UKCA Chemistry and Aerosol UMvn13.0 Tutorial 13
UKCA Chemistry and Aerosol Tutorials at UMvn13.0
| Difficulty | HARD |
| Time to Complete | 2 or more hours |
| Video instructions |
What you will learn in this Tutorial
In this tutorial you will learn how to plot and process UKCA data using the Iris and cf python packages. Example notebooks are provided using both packages, which can be also be viewed here:
and can be found in the
Tutorials/UMvn13.0/notebooks
directory on your virtual machine.
You should work through the notebook to see how the plots are generated. Also compare the different methods between cf and Iris - are some thing easier or harder to do using a particular package. At the end of each notebook are some suggested examples which you should think about and complete.
Observations
This tutorial also makes use of the Bodeker Scientific version 3.4.1 TCO dataset. For ease of use this has been processed from annual files into a single file using the following commands:
for i in `ls *.nc`; do echo $i; ncks -O --mk_rec_dmn time $i $i; done
for i in `ls *.nc`; do echo $i; ncatted -O -a created,global,d,, $i; done
for i in `ls *.nc`; do echo $i; ncatted -O -a units,longitude,o,c,degrees_east $i; done
for i in `ls *.nc`; do echo $i; ncatted -O -a units,latitude,o,c,degrees_north $i; done
ncrcat BSFilledTCO_V3.4.1_????_Monthly.nc ../BSFilledTCO_V3.4.1_Monthly.nc
We would like to thank Bodeker Scientific, funded by the New Zealand Deep South National Science Challenge, for providing the combined NIWA-BS total column ozone database.
Exercise 1: Plot zonal-mean total column ozone
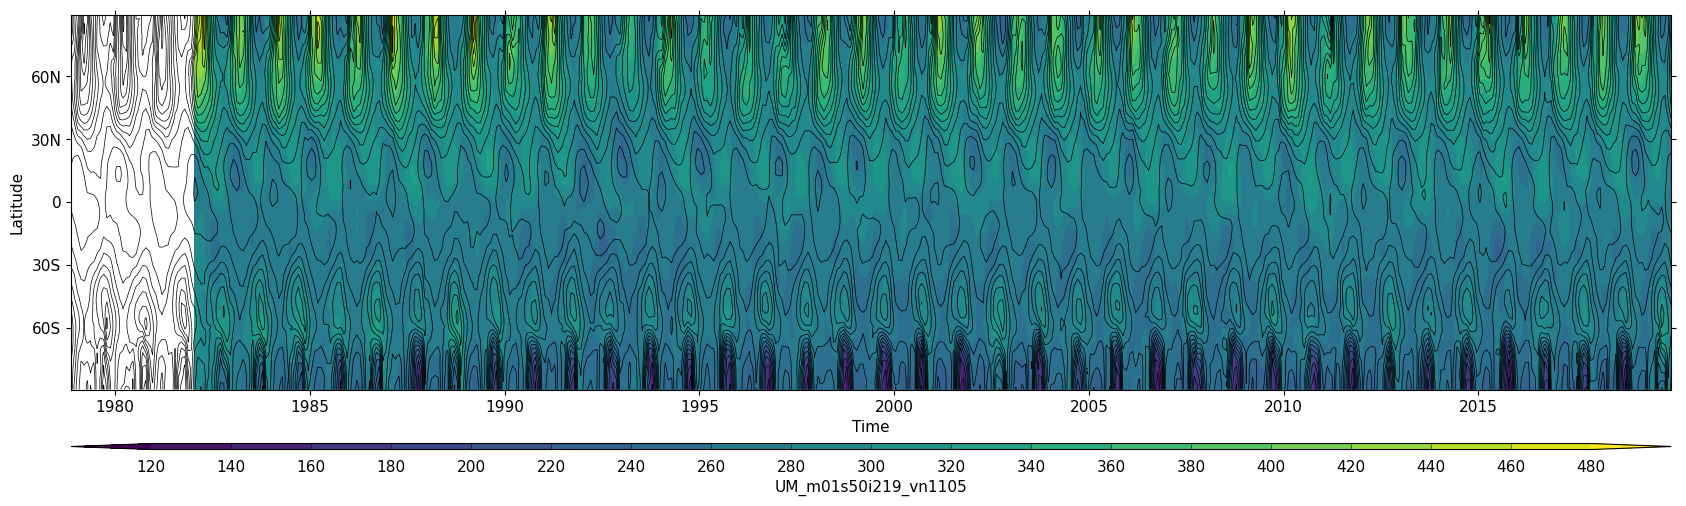
Total Column Ozone timeseries comparing UKCA and the Bodeker dataset produced using cf-python.
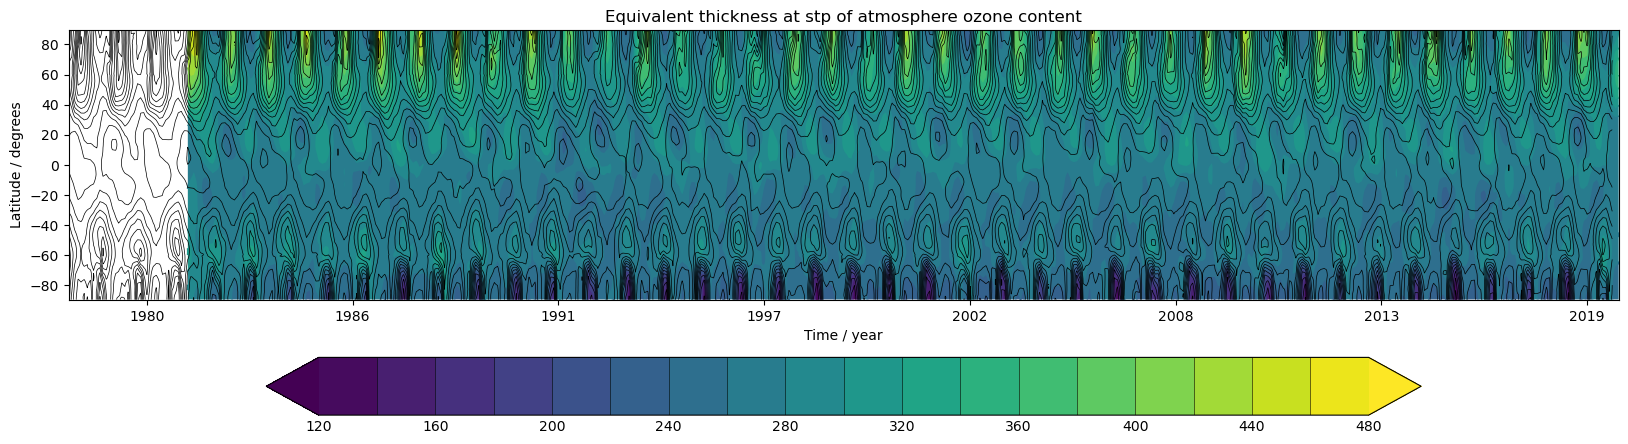
Total Column Ozone timeseries comparing UKCA and the Bodeker dataset produced using Iris.


Using the *_toz01.ipynb files for cf and for Iris
Checklist
- ☐
UKCA Chemistry and Aerosol Tutorials at UMvn13.0
Written by Luke Abraham 2022.