Difference between revisions of "UKCA & UMUI Tutorial 3"
| Line 60: | Line 60: | ||
xhklga.pm1992sep.pp |
xhklga.pm1992sep.pp |
||
| − | As you can see, there is only one file present, the '''"pm"''' file. This file is a montly-mean file that has come from the climate-meaning stream (climate-meaning |
+ | As you can see, there is only one file present, the '''"pm"''' file. This file is a montly-mean file that has come from the climate-meaning stream (climate-meaning has been covered in more detail in the [[UKCA & UMUI Tutorial 2 | What is STASH?]] tutorial). |
$ ls |
$ ls |
||
| Line 73: | Line 73: | ||
Stash code = 34... |
Stash code = 34... |
||
| − | e.g. <tt>Stash code = 34001</tt> etc. These are the UKCA chemical tracer and diagnostic fields (although they are not labeled as such by default). A full listing of these can be found in the [[listing of UKCA fields at UM8.2]]. More information |
+ | e.g. <tt>Stash code = 34001</tt> etc. These are the UKCA chemical tracer and diagnostic fields (although they are not labeled as such by default). A full listing of these can be found in the [[listing of UKCA fields at UM8.2]]. More information has been given on STASH in the [[UKCA & UMUI Tutorial 2 | What is STASH?]] tutorial. |
You can use Xconv to view certain fields. For example, you could view the surface ozone concentration double-clicking on the ''Stash code = 34001'' field and clicking the '''Plot data''' button (see Figure 2). While this is good to quickly check data, the plotting functions are rather limited as it is not possible to change e.g. the colour-bar, the scale, add a map projection etc. It is advisable to either export fields as netCDF from within Xconv, or to use another program, such as IDL (using the [http://cms.ncas.ac.uk/documents/IDL/idl_guide.html Met Office library]) or Python (using either [http://cfpython.bitbucket.org/ cf-python] or [http://scitools.org.uk/iris/ Iris]) which is able to read the UM PP/FieldsFile format directly. |
You can use Xconv to view certain fields. For example, you could view the surface ozone concentration double-clicking on the ''Stash code = 34001'' field and clicking the '''Plot data''' button (see Figure 2). While this is good to quickly check data, the plotting functions are rather limited as it is not possible to change e.g. the colour-bar, the scale, add a map projection etc. It is advisable to either export fields as netCDF from within Xconv, or to use another program, such as IDL (using the [http://cms.ncas.ac.uk/documents/IDL/idl_guide.html Met Office library]) or Python (using either [http://cfpython.bitbucket.org/ cf-python] or [http://scitools.org.uk/iris/ Iris]) which is able to read the UM PP/FieldsFile format directly. |
||
Revision as of 12:11, 7 June 2013
Running an existing UKCA job
You will need to change a number of options within the UMUI to allow you to run this job successfully, such as your username, HECToR TIC code (if needed) etc. If you are using the MONSooN job you may also need to change the project group in
Model Selection
-> Post Processing
 -> Main Switch + General Questions
if you want to send output data to the /nerc data disk (this is advisable).
Once you have made these changes you can submit your job. First click Save, then Process, and once this has completed, click Submit. This will then extract the code from the FCM repositories and submit them to the supercomputer. If you are running on MONSooN you will need to enter your passcode at this stage.
Checking the progress of a running job
Log-in to the supercomputer, and check that your job is running. For HECToR do
qstat -u $USER
and for MONSooN do
llq -u $USER
This should give a list of your running jobs. For example, on MONSooN you should get something like
$ llq -u $USER
Id                       Owner      Submitted   ST PRI Class        Running On
------------------------ ---------- ----------- -- --- ------------ -----------
mon001.64641.0           nlabra      6/5  12:36 R  50  parallel     c139

1 job step(s) in query, 0 waiting, 0 pending, 1 running, 0 held, 0 preempted
You can also check how far a job has gone while it is running. To do this you will need to cd into the job directory (this will be on your /work space on HECToR or your /projects space on MONSooN). When you do this, you will see something like this
$ ls
baserepos/  pe_output/  umrecon/    xhklg.apstmp1  xhklg.astart  xhklg.out       xhklg.stash    xhklg.xhist           xhklga.pc19920901
bin/        umatmos/    umscripts/  xhklg.apsum1   xhklg.list    xhklg.requests  xhklg.umui.nl  xhklga.da19920921_00  xhklga.pe1992sep
Now cd into the pe_output/ directory and do
$ tail -f jobid.fort6.pe0 | grep Atm_Step
Atm_Step: Timestep     1744   Model time:   1992-09-25 05:20:00
Atm_Step: Timestep     1745   Model time:   1992-09-25 05:40:00
Atm_Step: Timestep     1746   Model time:   1992-09-25 06:00:00
Atm_Step: Timestep     1747   Model time:   1992-09-25 06:20:00
Atm_Step: Timestep     1748   Model time:   1992-09-25 06:40:00
Atm_Step: Timestep     1749   Model time:   1992-09-25 07:00:00
(changing jobid as appropriate for your job).
Viewing and extracting output
To take a look at the output, you will need to change into the directory where the data has been archived. On HECToR this should be in the archive/ sub-directory, on MONSooN it will be on /nerc/project/$USER/jobid. Once in this directory ls to see the file listing
$ ls
xhklga.pm1992sep.pp
As you can see, there is only one file present, the "pm" file. This file is a montly-mean file that has come from the climate-meaning stream (climate-meaning has been covered in more detail in the What is STASH? tutorial).
$ ls
xhklga.pm1992sep.pp
To quickly view output you can use Xconv, which provides a simple data viewer. It can also be used to convert the UM format output files to netCDF. You can open this file by
$ xconv -i xhklga.pm1992sep.pp
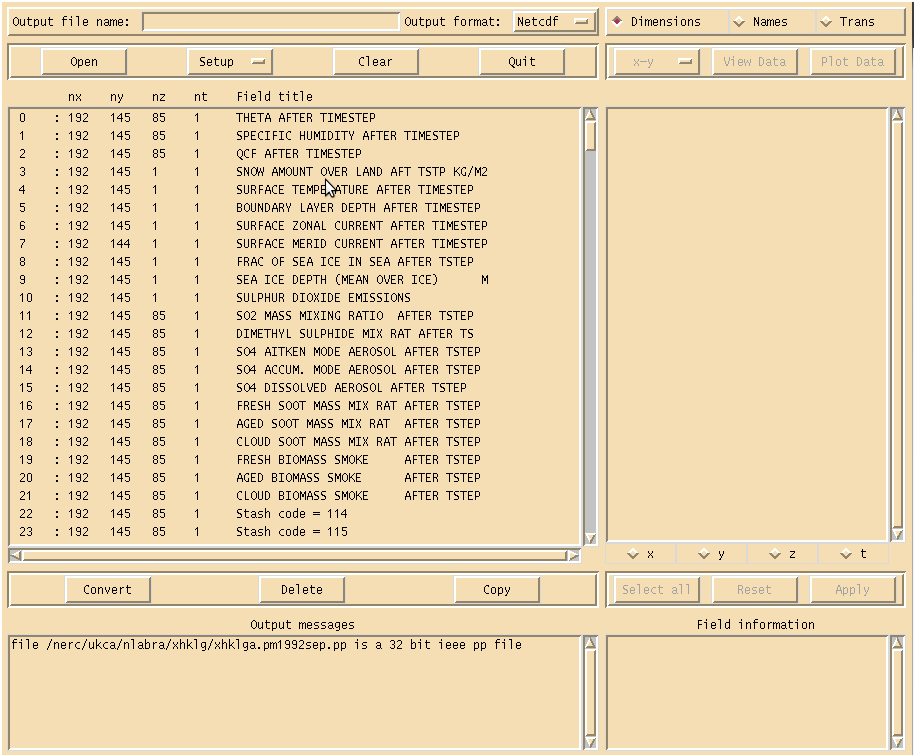
which will show the Xconv window as can been seen in Figure 1. If you scroll down the list of fields you will find ones that begin
Stash code = 34...
e.g. Stash code = 34001 etc. These are the UKCA chemical tracer and diagnostic fields (although they are not labeled as such by default). A full listing of these can be found in the listing of UKCA fields at UM8.2. More information has been given on STASH in the What is STASH? tutorial.
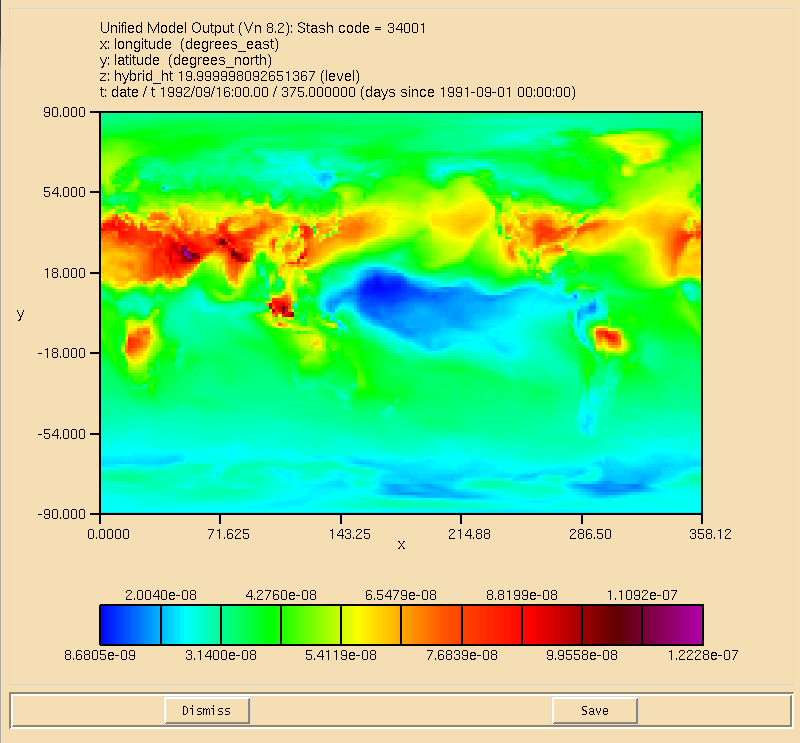
You can use Xconv to view certain fields. For example, you could view the surface ozone concentration double-clicking on the Stash code = 34001 field and clicking the Plot data button (see Figure 2). While this is good to quickly check data, the plotting functions are rather limited as it is not possible to change e.g. the colour-bar, the scale, add a map projection etc. It is advisable to either export fields as netCDF from within Xconv, or to use another program, such as IDL (using the Met Office library) or Python (using either cf-python or Iris) which is able to read the UM PP/FieldsFile format directly.
To export fields as netCDF select them using the mouse (they should then highlight blue), enter a name for the netCDF file in the Output file name box (making sure that the Output format is Netcdf) and click the Convert button. The window on the bottom right will show the progress of the conversion. For single fields this is usually quite quick, but it is possible to use Xconv to open multiple files containing a series of times. In this case Xconv will combine all the individual times into a single field, and outputting this can take some time.
One issue you may have is that Xconv uses a quantity called the field code to determine the variable name of each field (the netCDF name attribute). For UKCA tracer fields at UM8.2 this code is all the same, so all variables will be called field1861. It is possible to change the short field name in Xconv, prior to outputting a netCDF file. Select the variable you wish to output and select the Names button on the top-right of the Xconv window. Delete the contents of the short field name box and replace it with what you would like, e.g. for ozone (Stash code 34001) you may wish to use the CF standard name mass_fraction_of_ozone_in_air (as the units of UKCA tracers are kg(species)/kg(air)). The click apply and output the field as normal. When running ncdump on the resultant netCDF file you should see something like
       float mass_fraction_of_ozone_in_air(t, hybrid_ht, latitude, longitude) ;
               mass_fraction_of_ozone_in_air:source = "Unified Model Output (Vn 8.2):" ;
               mass_fraction_of_ozone_in_air:name = "mass_fraction_of_ozone_in_air" ;
               mass_fraction_of_ozone_in_air:title = "Stash code = 34001" ;
               mass_fraction_of_ozone_in_air:date = "01/09/91" ;
               mass_fraction_of_ozone_in_air:time = "00:00" ;
               mass_fraction_of_ozone_in_air:long_name = "Stash code = 34001" ;
               mass_fraction_of_ozone_in_air:units = " " ;
               mass_fraction_of_ozone_in_air:missing_value = 2.e+20f ;
               mass_fraction_of_ozone_in_air:_FillValue = 2.e+20f ;
               mass_fraction_of_ozone_in_air:valid_min = 8.680486e-09f ;
               mass_fraction_of_ozone_in_air:valid_max = 1.84475e-05f ;
Once you have your data as netCDF it is then possible to use any standard visualisation or processing package to view and manipulate the data.

