Coupled stratospheric chemistry: Difference between revisions
(New page: =Stratospheric Chemistry = ''Dr. Olaf Morgenstern, University of Cambridge'' The UKCA model can be run in a stratospheric mode, in which case a gasphase and heterogeneous chemistry suita...) |
(Page created) |
||
| Line 3: | Line 3: | ||
''Dr. Olaf Morgenstern, University of Cambridge'' |
''Dr. Olaf Morgenstern, University of Cambridge'' |
||
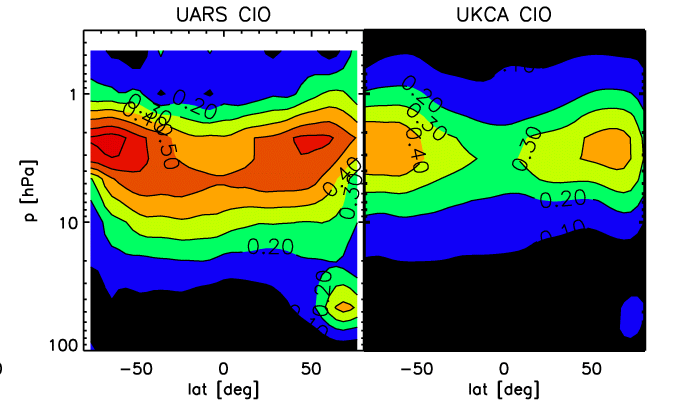
The UKCA model can be run in a stratospheric mode, in which case a gasphase and heterogeneous chemistry suitable for the stratosphere is selected and the model domain extends from the surface to 84 km of altitude with 60 levels in the vertical. We present some results of a time slice experiment, representing present-day conditions for chlorine and bromine loading. The experiment is started in September; the monthly-mean figures refer to February, 19 months later, and are interpolated to pressure levels. Also displayed are the corresponding climatologies, from instruments on board the Upper Atmosphere Reseach Satellite (UARS), and scatter plots in a log-log depiction of UKCA versus UARS data. This experiment has the chemistry coupled to the model's radiation scheme using ozone, methane, nitrous oxide and CFCs F11 and F12. |
[[Image:O3_feb.gif|thumb|left|Figure 1]][[Image:Xagcn_ozcolumn.gif|thumb|right|Figure 2]][[Image:Ch4_feb.gif|thumb|left|Figure 3]][[Image:Hcl_feb.gif|thumb|left|Figure 4]][[Image:Clo_feb.gif|thumb|left|Figure 5]]The UKCA model can be run in a stratospheric mode, in which case a gasphase and heterogeneous chemistry suitable for the stratosphere is selected and the model domain extends from the surface to 84 km of altitude with 60 levels in the vertical. We present some results of a time slice experiment, representing present-day conditions for chlorine and bromine loading. The experiment is started in September; the monthly-mean figures refer to February, 19 months later, and are interpolated to pressure levels. Also displayed are the corresponding climatologies, from instruments on board the Upper Atmosphere Reseach Satellite (UARS), and scatter plots in a log-log depiction of UKCA versus UARS data. This experiment has the chemistry coupled to the model's radiation scheme using ozone, methane, nitrous oxide and CFCs F11 and F12. |
||
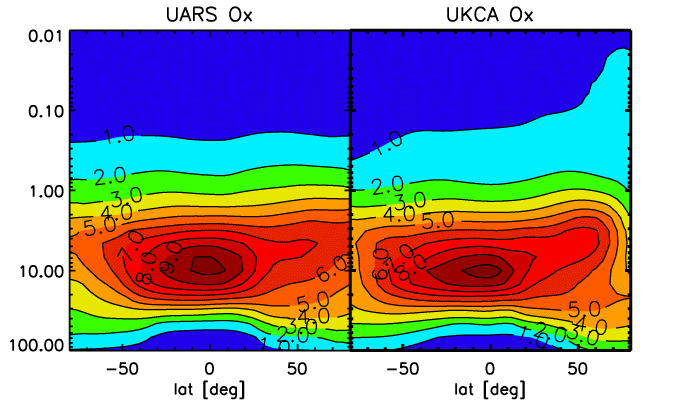
*Figure A. Zonal-mean ozone (O3) volume mixing ratio, in ppmv. |
*Figure A. Zonal-mean ozone (O3) volume mixing ratio, in ppmv. |
||
Latest revision as of 11:11, 4 May 2010
Stratospheric Chemistry
Dr. Olaf Morgenstern, University of Cambridge
The UKCA model can be run in a stratospheric mode, in which case a gasphase and heterogeneous chemistry suitable for the stratosphere is selected and the model domain extends from the surface to 84 km of altitude with 60 levels in the vertical. We present some results of a time slice experiment, representing present-day conditions for chlorine and bromine loading. The experiment is started in September; the monthly-mean figures refer to February, 19 months later, and are interpolated to pressure levels. Also displayed are the corresponding climatologies, from instruments on board the Upper Atmosphere Reseach Satellite (UARS), and scatter plots in a log-log depiction of UKCA versus UARS data. This experiment has the chemistry coupled to the model's radiation scheme using ozone, methane, nitrous oxide and CFCs F11 and F12.
- Figure A. Zonal-mean ozone (O3) volume mixing ratio, in ppmv.
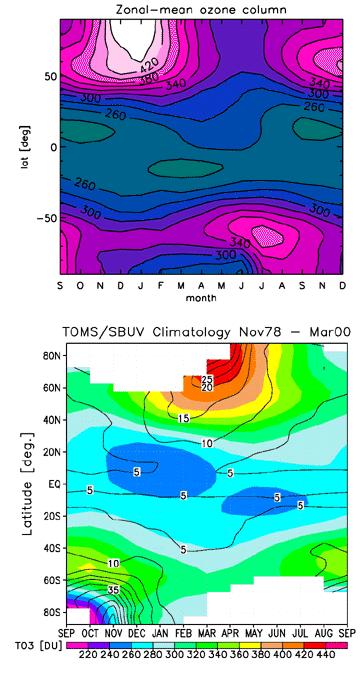
- Figure B. Zonal-mean ozone column, in Dobson Units, covering the period September to December (15 months), versus a satellite climatology derived from the TOMS and SBUV instruments.
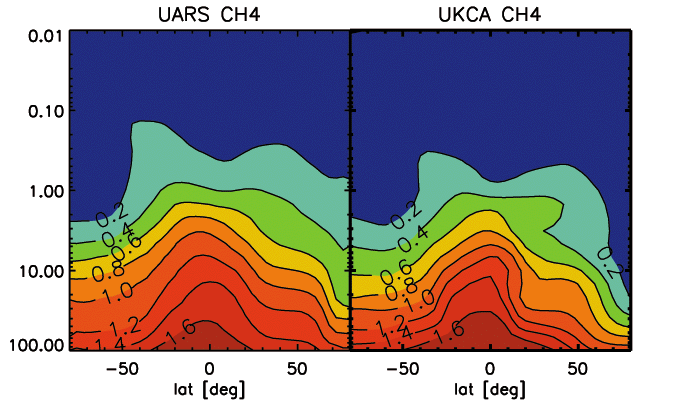
- Figure C. Same as A., but for methane (CH4).
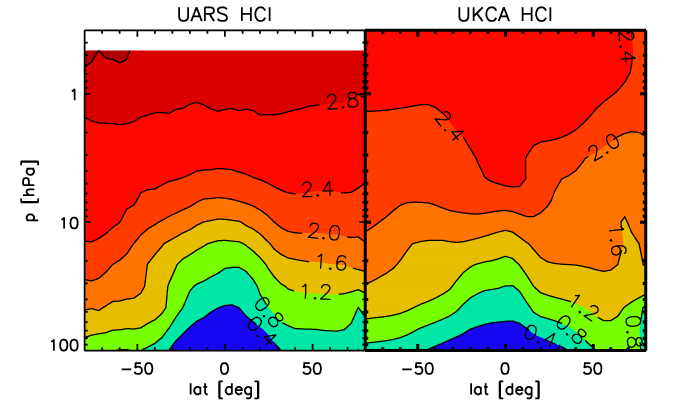
- Figure D. Same as A., but for chloric acid (HCl), in ppbv.
- Figure E. Same as A., but for chlorine monoxide (ClO).
The model captures the general structures of the displayed species rather well. The ozone distribution does not exhibit any mayor systematic bias anymore, although some deficiencies remain, especially in the polar regions. The ozone column away from the poles is well captured, especially bearing in mind that a few DU of systematic deficit can be explained by lacking tropospheric ozone production which is much underestimated in this model version due to exclusion of higher organics. In the polar regions, especially over Antarctica, ozone depletion is probably underestimated; an apparent "ozone hole" over Antartica may well have been caused by excessive downward transport of ozone-poor upper-stratospheric air. In reality a substantially deeper hole is observed in most springs. This feature is still being worked on.
For methane, again the model generally does a good job at reproducing the observed distribution, apart from winter pole, where subsidence is apparently again to strong and brings methane-depleted air to low altitudes. For chlori acid, below 10 hPa there is a reasonable correspondence between the model results and the climatology. Above that level, the model systematically underestimates HCl.
