UKCA Chemistry and Aerosol UMvn13.9 Tutorial 17
UKCA Chemistry and Aerosol Tutorials at UMvn13.9
| Difficulty | MEDIUM |
| Time to Complete | 1-2 hours |
| Video instructions | https://www.youtube.com/watch?v=aysibeNdLUY&t=21009s |
What you will learn in this Tutorial
Here you will learn more about working with the Met Office's next generation atmospheric model, LFRic, part of the Momentum framework.
LFRic does not use a regular latitude-longitude grid like the UM, but instead uses a cubed-sphere mesh. This is similar to some football designs, and looks like a cube has been squashed into a sphere shape. This gives a much more even grid spacing across the whole world, unlike the UM grid which can have points very close together at the poles. These close points affect model stability and mean that the advection scheme has to do more work - having a more even grid spacing should mean that the model will be able to scale better to higher and higher resolutions.
UKCA has been included within LFRic and can be used at a number of different resolutions. Equivalent LFRic configurations to the Global Atmosphere and UKESM Unified Model set-ups that you may be used to using are currently being developed.
Example notebooks are provided, which can be also be viewed here:
and can be found in the
Tutorials/UMvn13.9/notebooks
directory on your virtual machine. Many thanks to Rob Waters for providing these scripts.
You should work through the notebook to see how the plots are generated and become familiar with how to work with the data formats.
In each notebook are some suggested examples which you should think about and complete.
Connect to the notebooks using
NOTE: you may want to close your existing Jupyter lab instance and then restart it via cylc-gui, as this may prevent any issues running high-memory python notebooks. You can either do this via File Shut Down or typing Ctrl-C within the terminal that is running the Cylc GUI server.

Exercise 1: The LFRic mesh
Here we will investigate 3 different LFRic resolutions, C12, C48, and C192. The number here refers to the number of points along the side of each square face. This means that a C12 grid has 48 grid points around the equator and an effective resolution of around 800km. A C48 grid has 192 grid points around the equator and has an effective resolution of around 200km, and the C192 grid has 768 points around the equator and an effective resolution of around 50km.
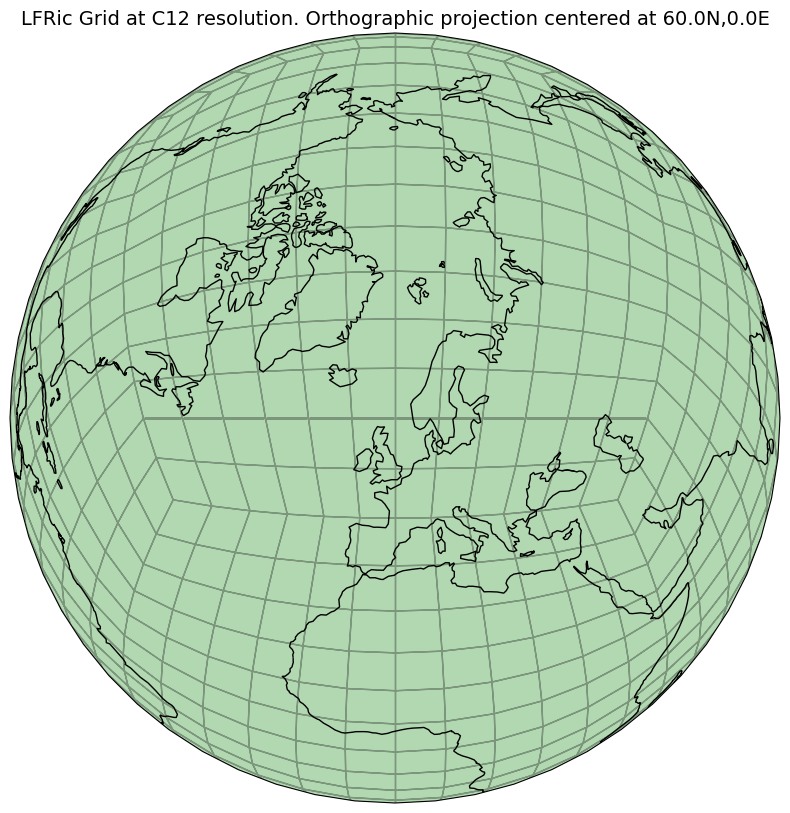
C12 grid (Orthographic projection)
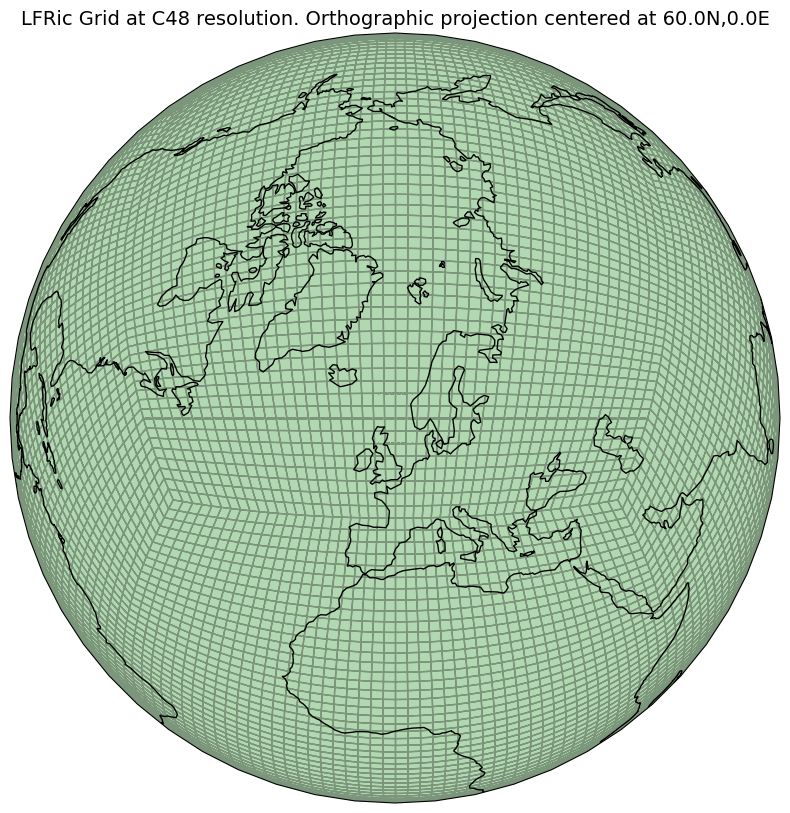
C48 grid (Orthographic projection)
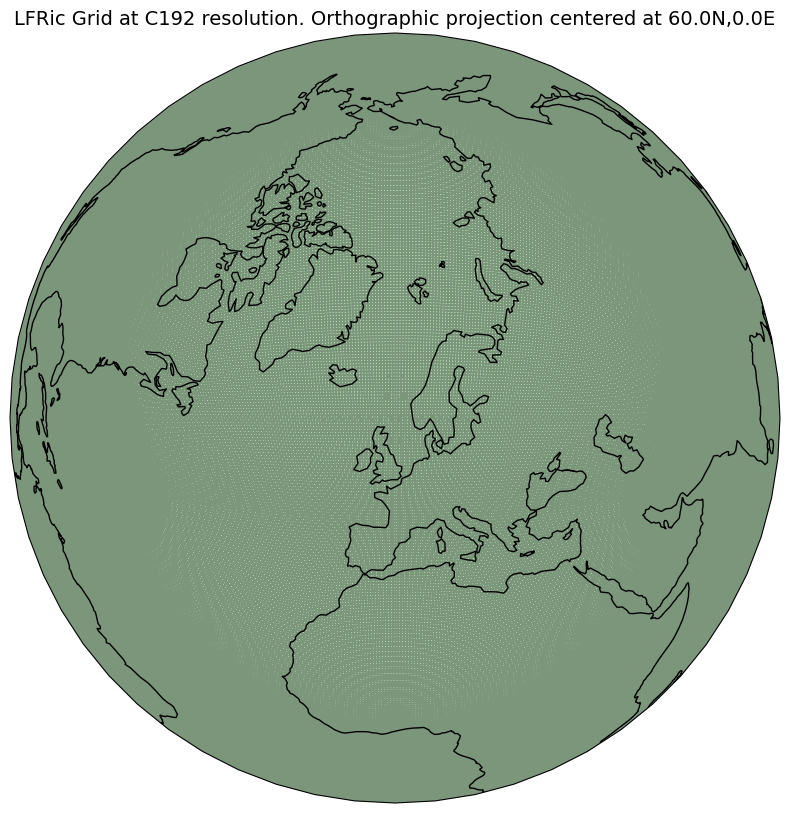
C192 grid (Orthographic projection)


You should use the lfric_meshes.ipynb file:
In this notebook you can change the mesh size used and look at the grid coverage of different countries using these meshes. Consider differences to the Unified Model grid currently used by UKESM.
Note that the C192 full map plots take around 15 minutes to produce. You may want to skip these cells and just run the regional plots.
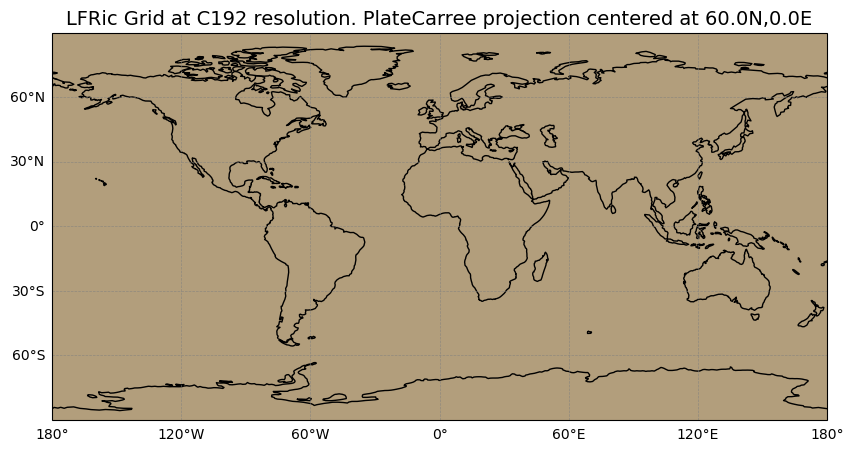
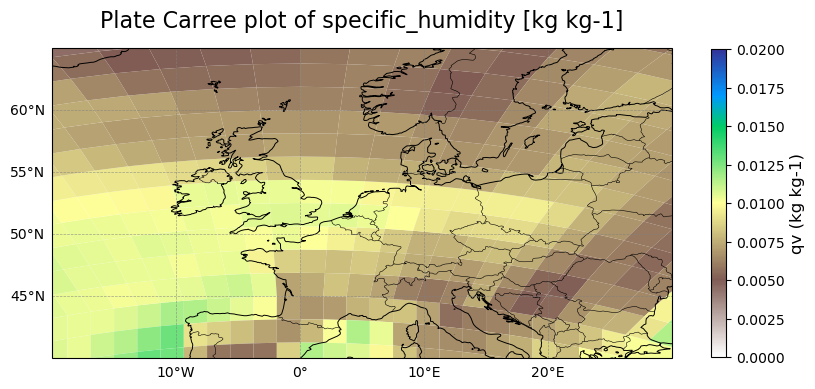
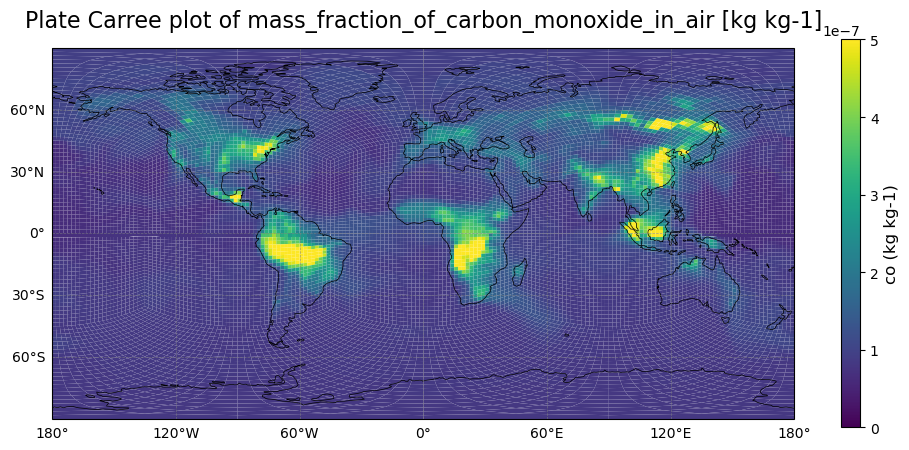
C192 grid (PlateCarree projection)

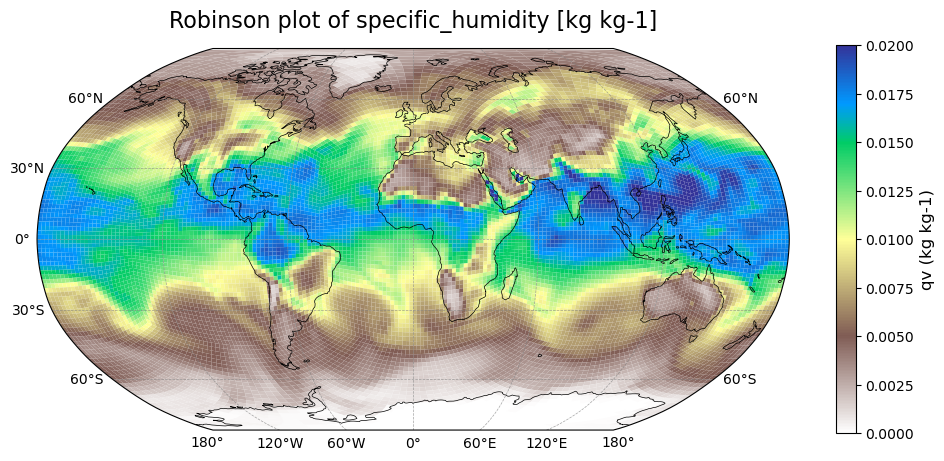
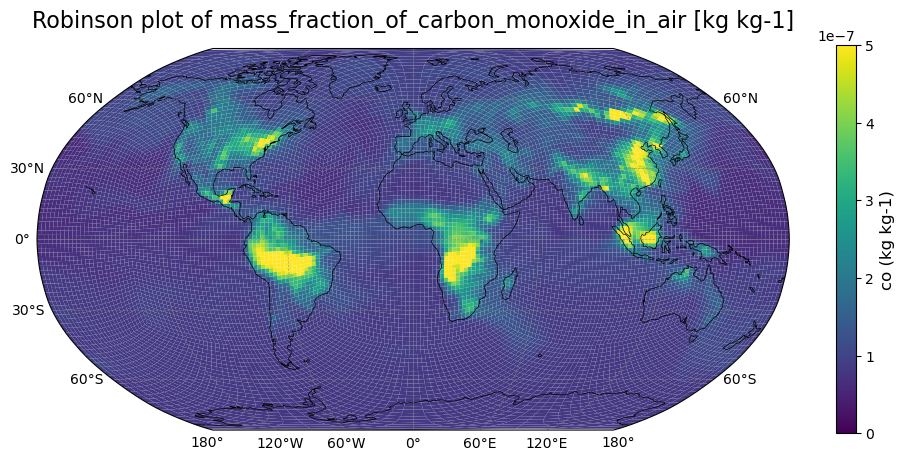
C192 grid (Robinson projection)


Solution to Exercise 1a: The UK
You were asked to think about how many grid cells cover the UK at different resolutions. In the plots below we can see how the grid changes and how this affects coverage of the UK.
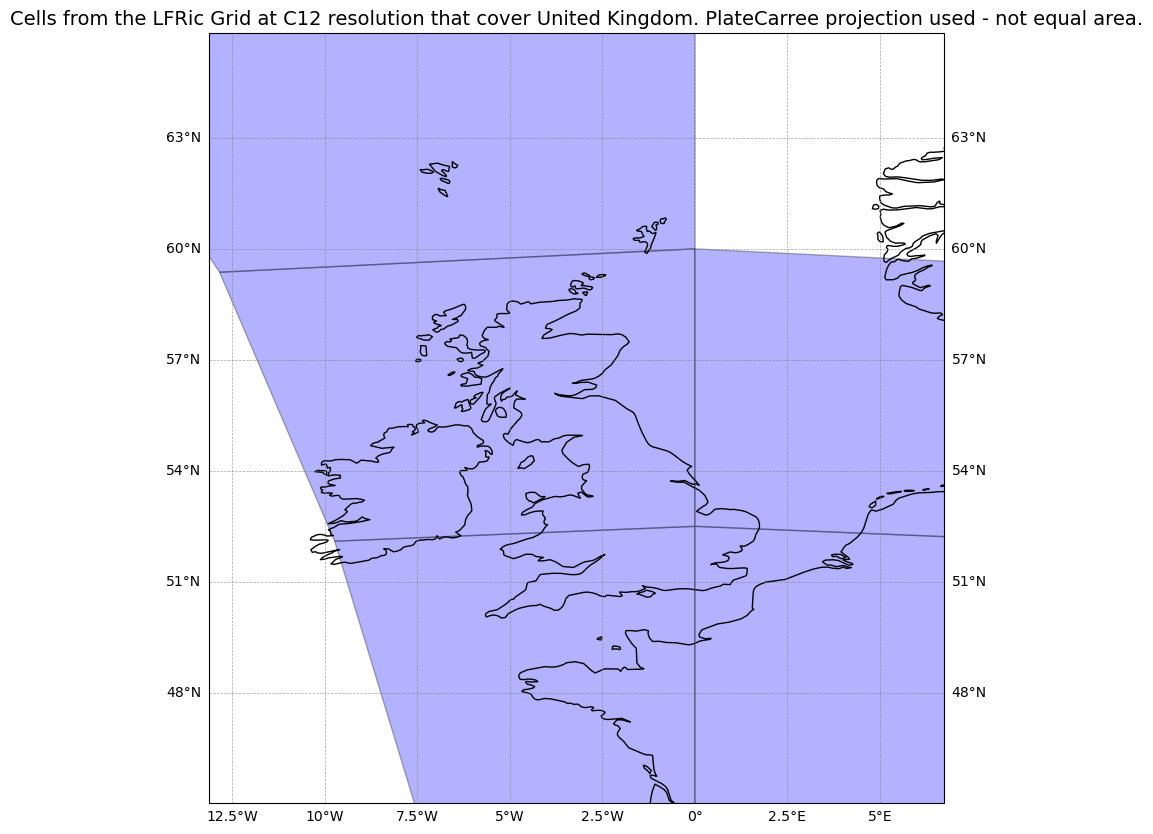
C12 grid over the UK
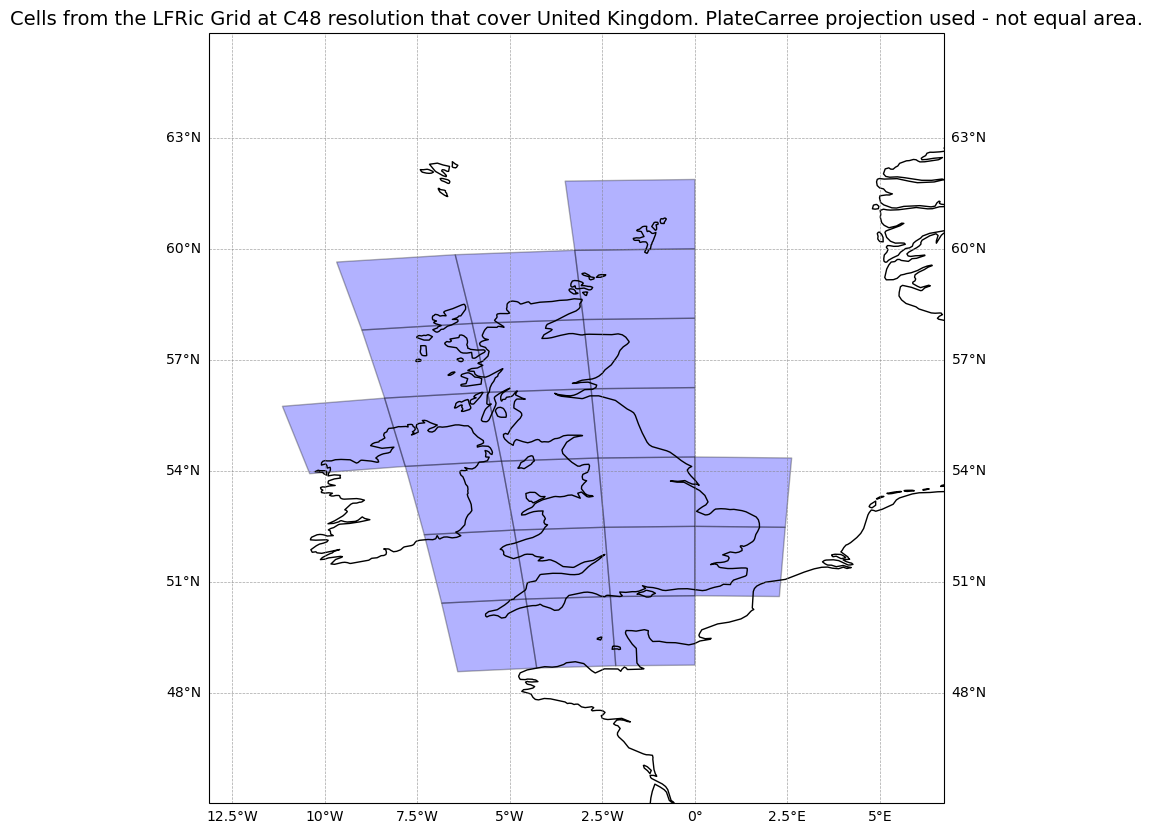
C48 grid over the UK
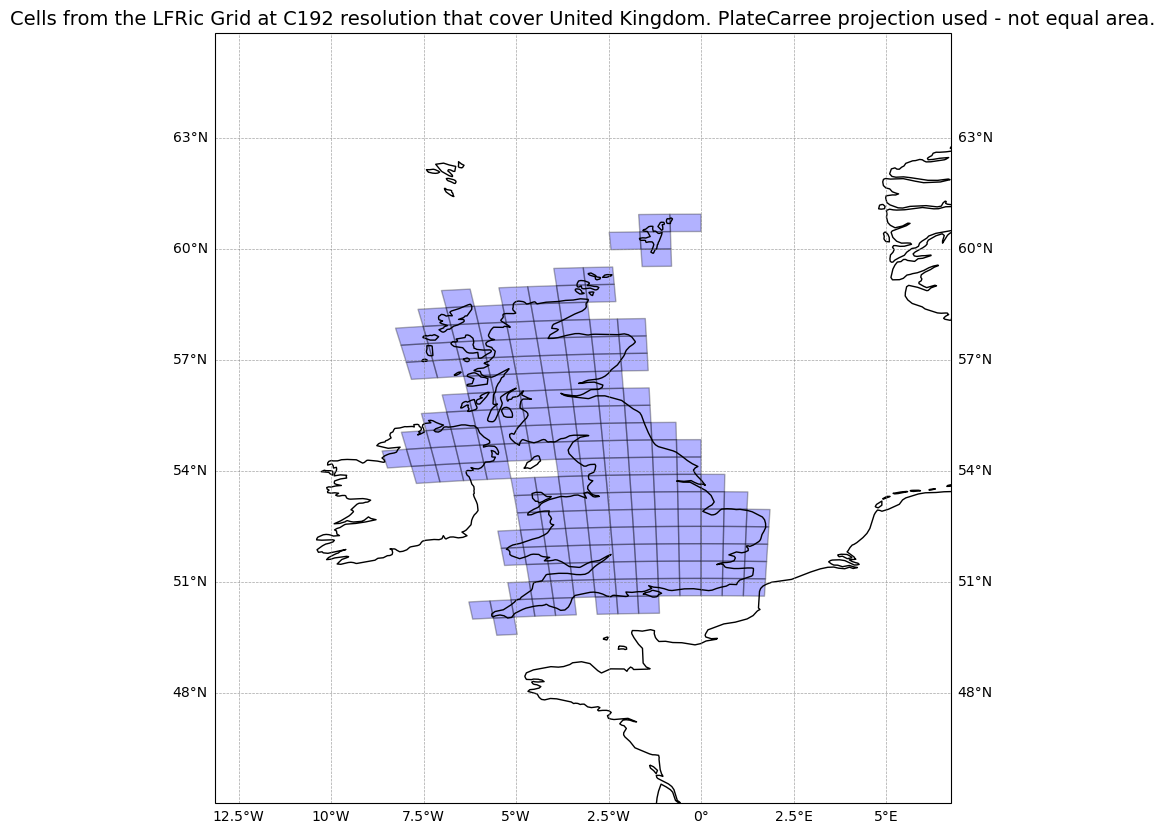
C192 grid over the UK


Solution to Exercise 1b: Greenland
You were asked to plot the points for Greenland at different resolutions and consider how this would be different from the UM grid.
| Hint |
|---|
| Consider how this grid is different compared to the regular latitude-longitude grid used by the UM, and what this means for the grid spacing around the poles. |
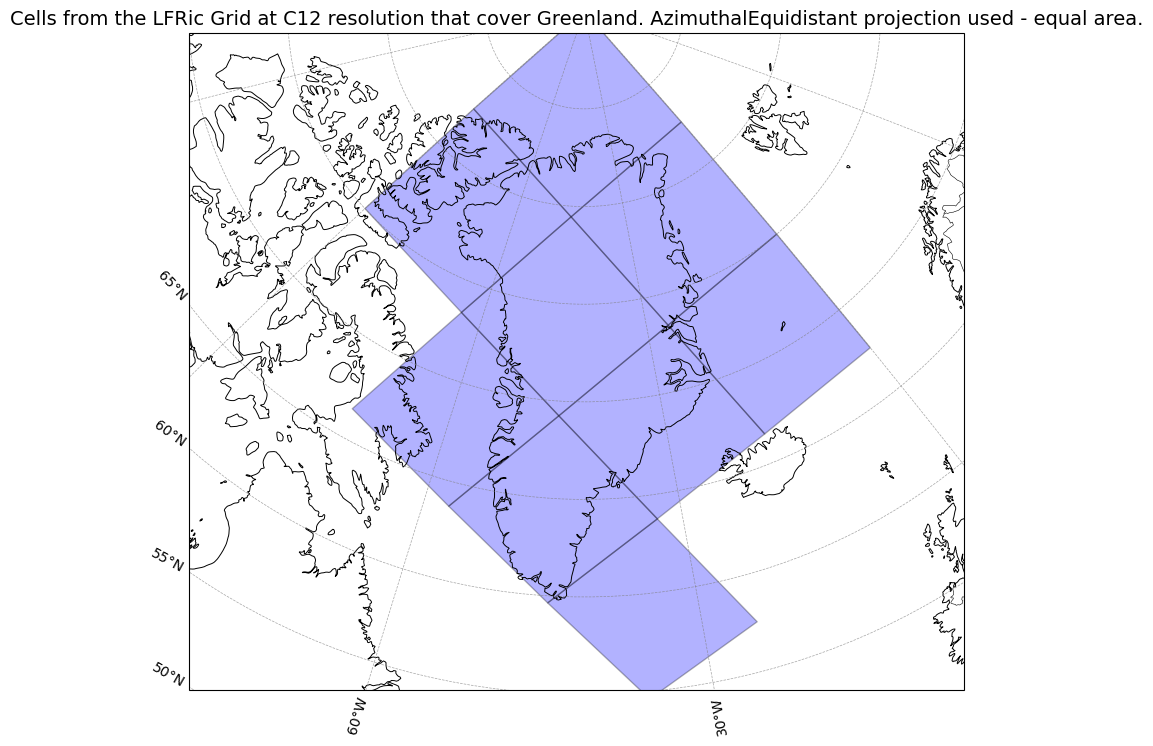
C12 grid over the UK
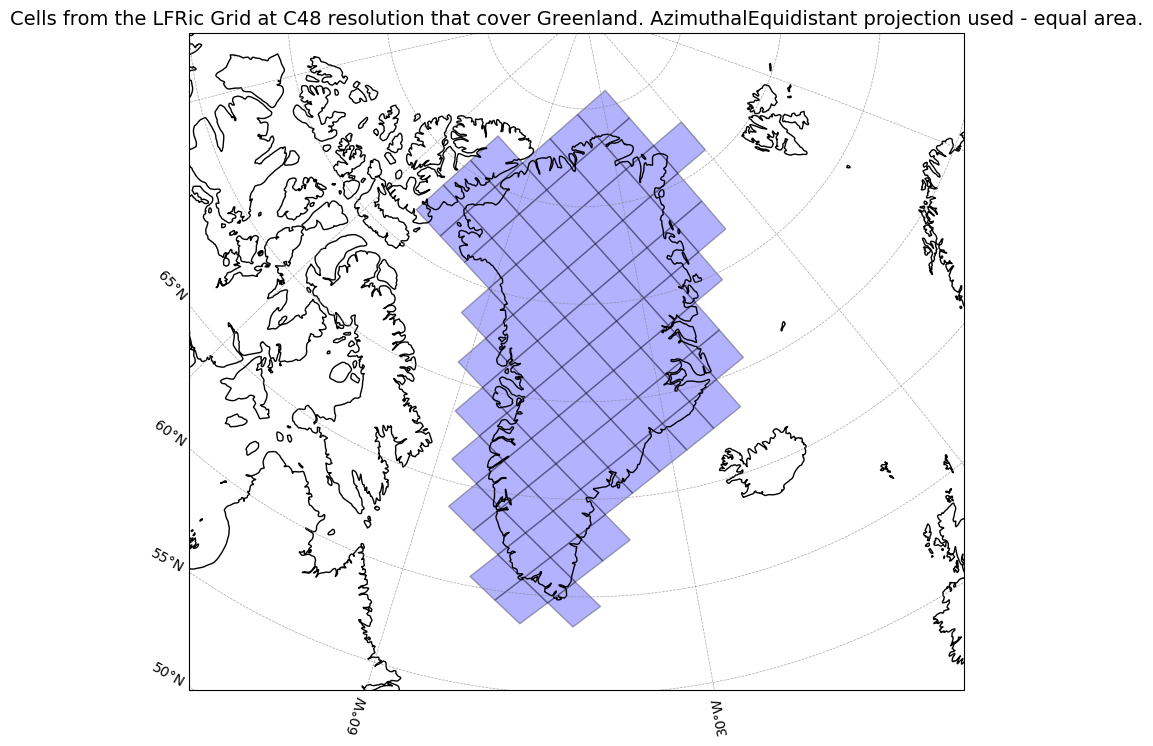
C48 grid over the UK
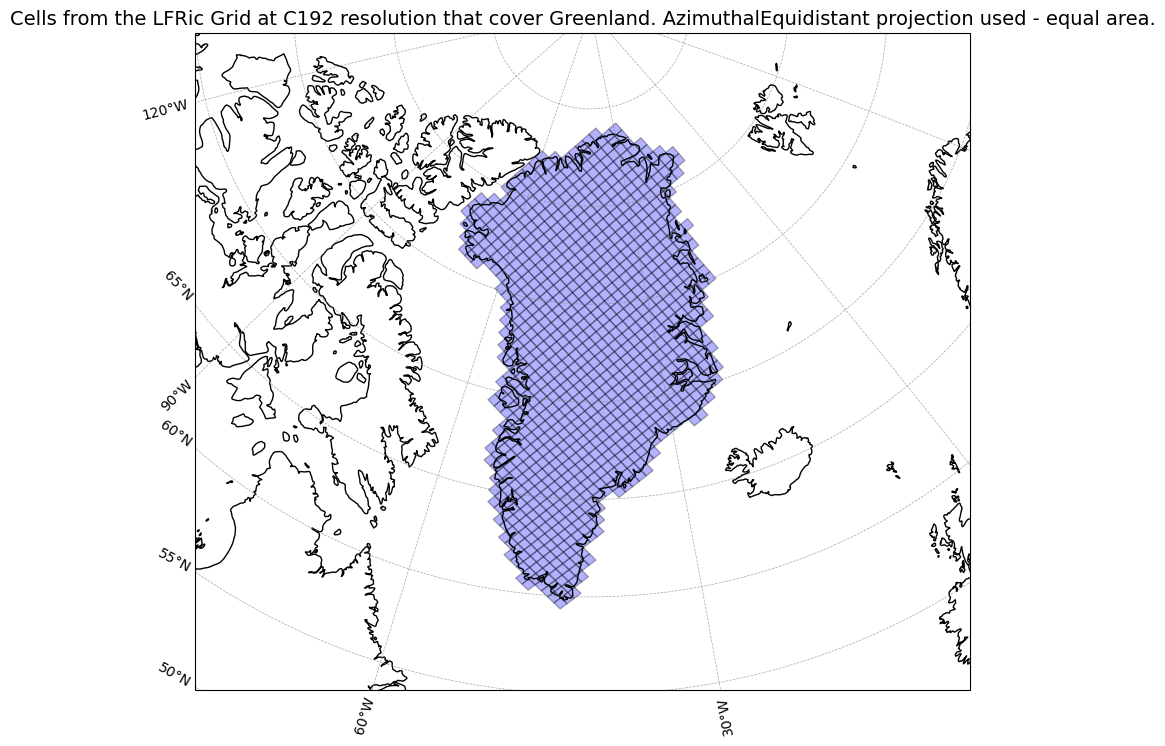
C192 grid over the UK


Further exercises
Try plotting other countries and see what the grid spacing is over each one.
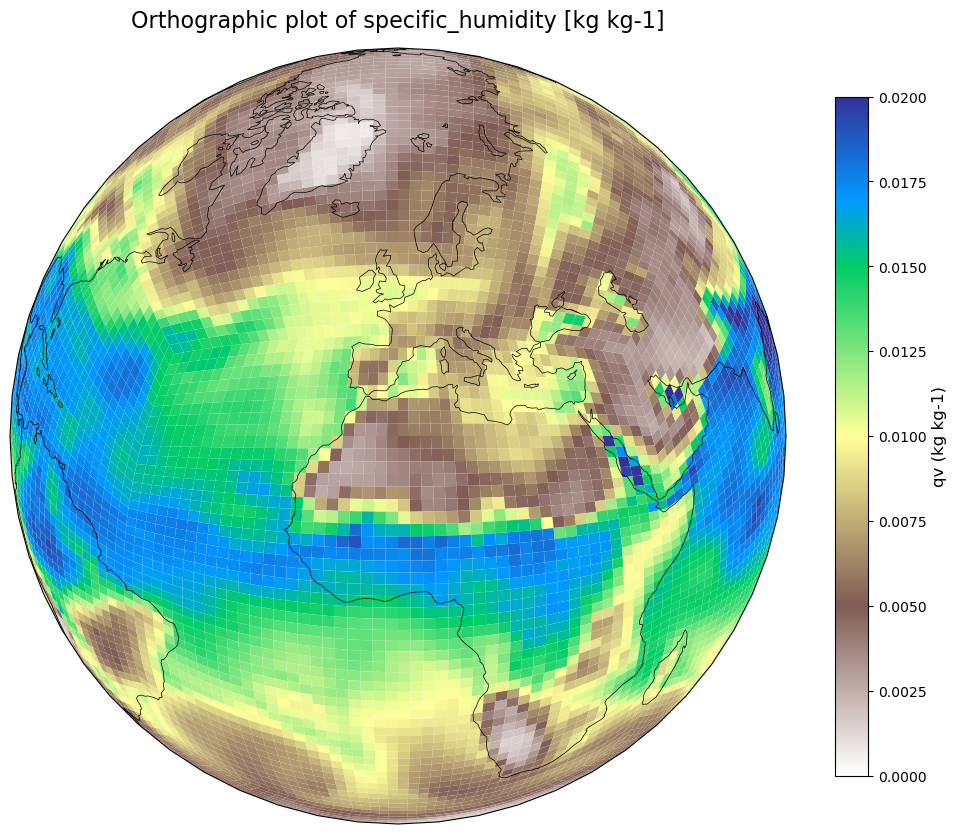
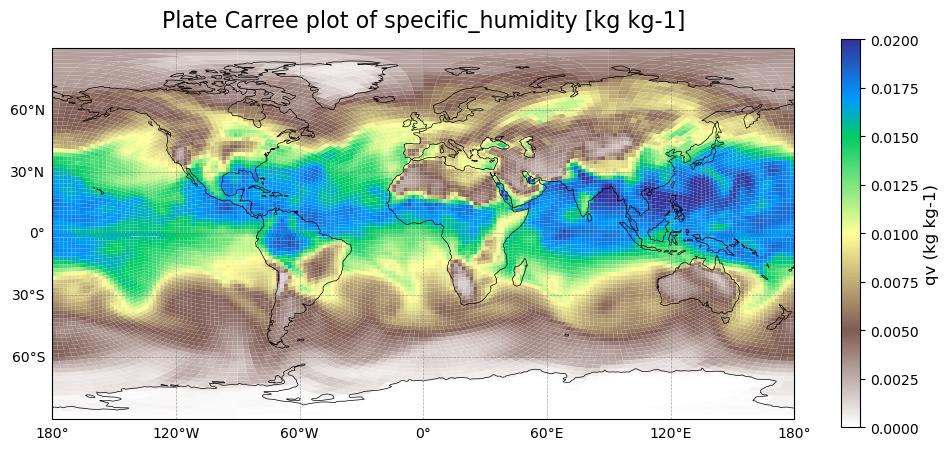
Exercise 2: Plot atmospheric composition data from LFRic
During this exercise you will plot a number of composition fields from a C48 LFRic atmosphere simulation. The available fields are:
- specific humidity (variable qv)
- carbon monoxide (variable co)
- nitric oxide (variable no)
- ozone (variable o3)
You should use the lfric_plots.ipynb file and change to use the appropriate variable:
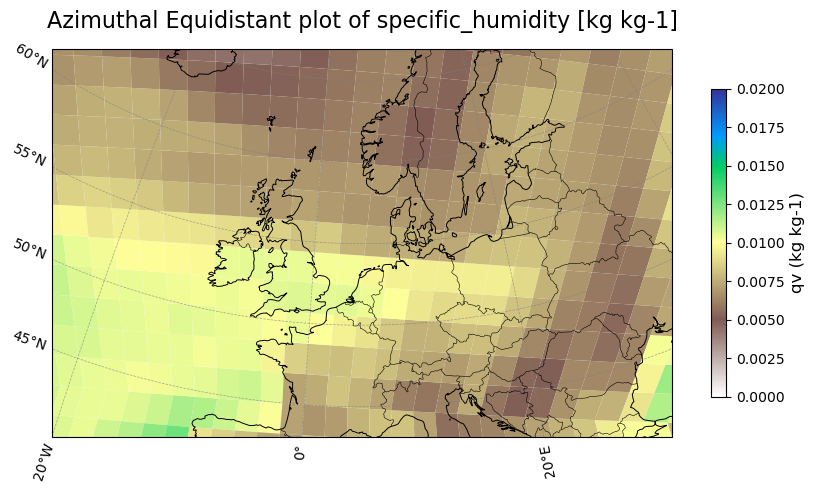
Exercise 2a: specific humidity
- C48 specific humidity at the surface


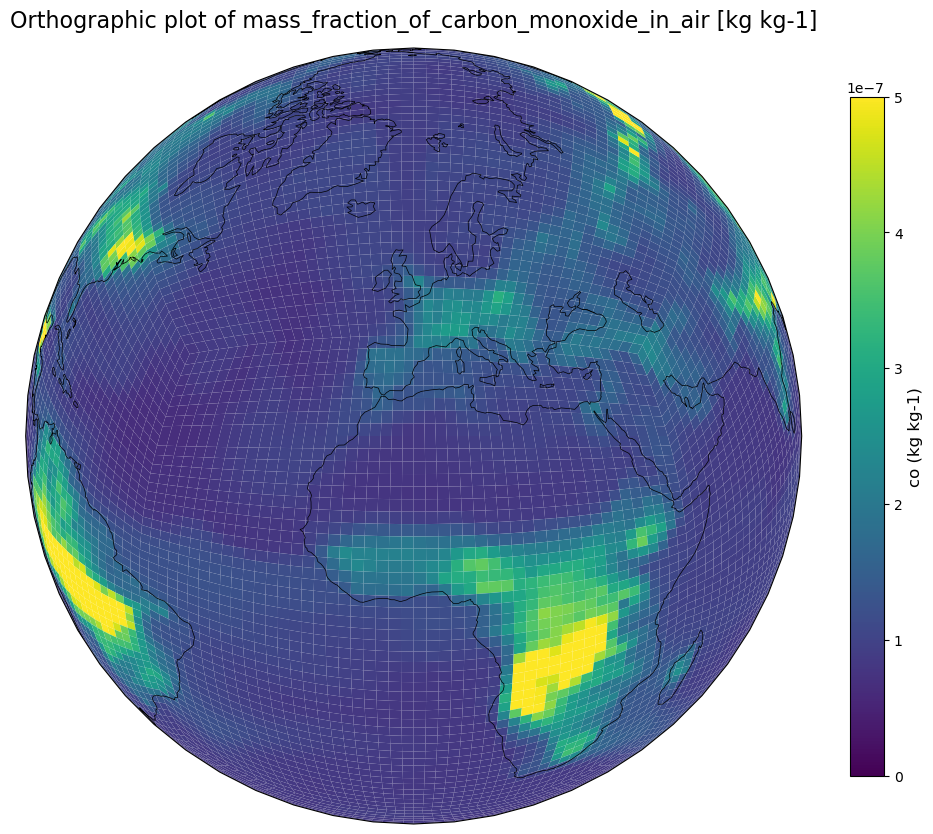
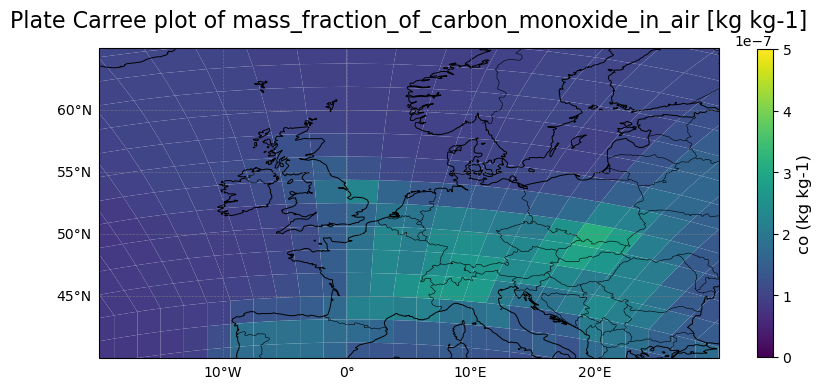
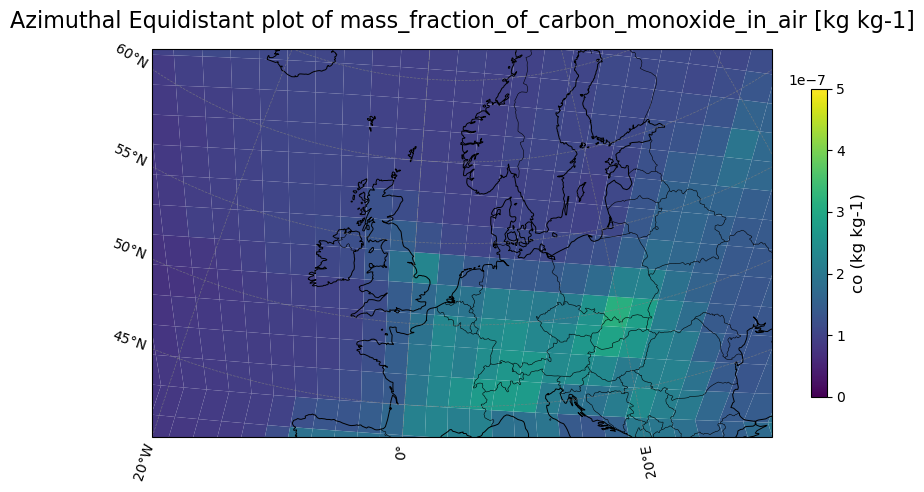
Exercise 2b: carbon monoxide
- C48 carbon monoxide at the surface


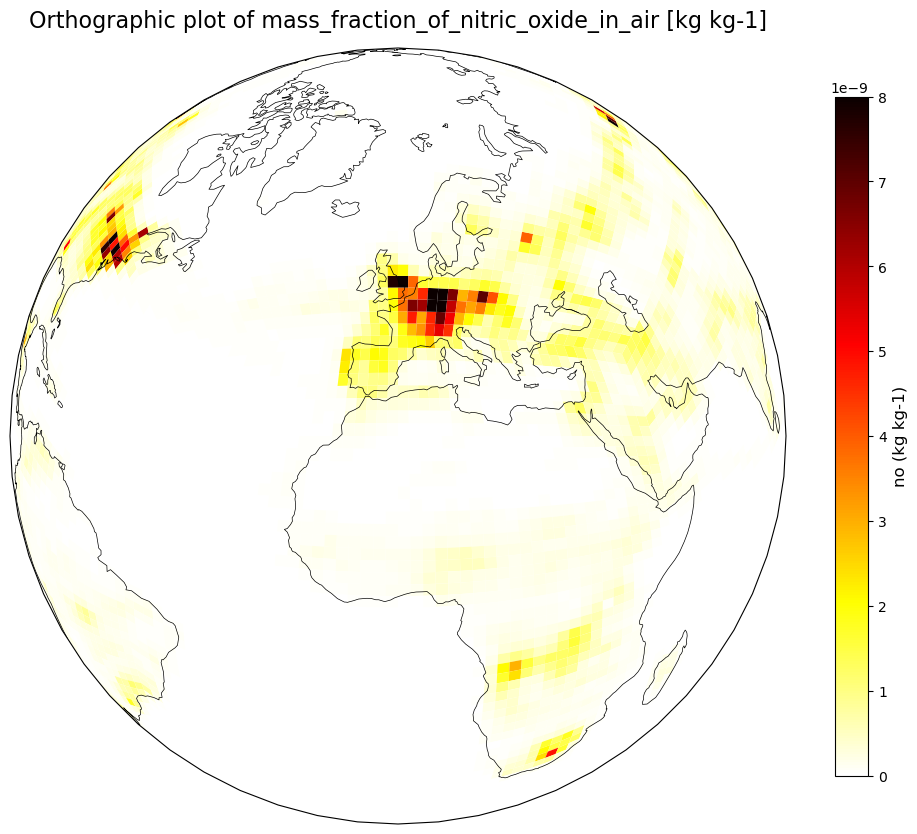
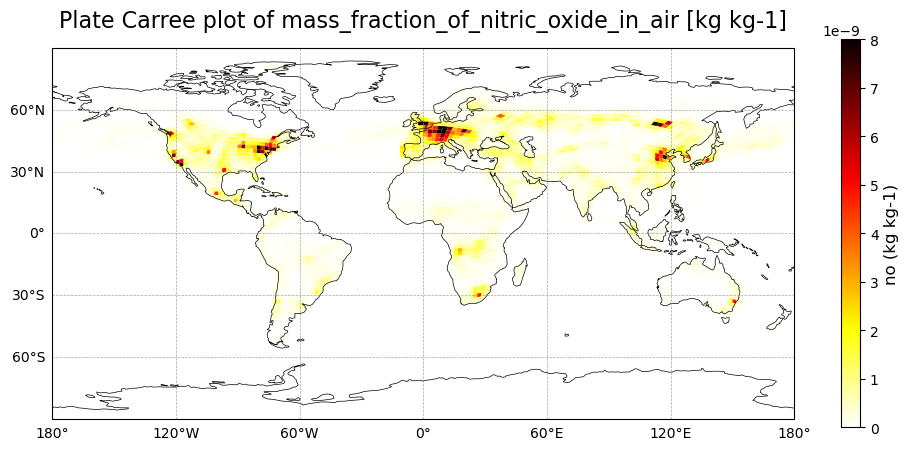
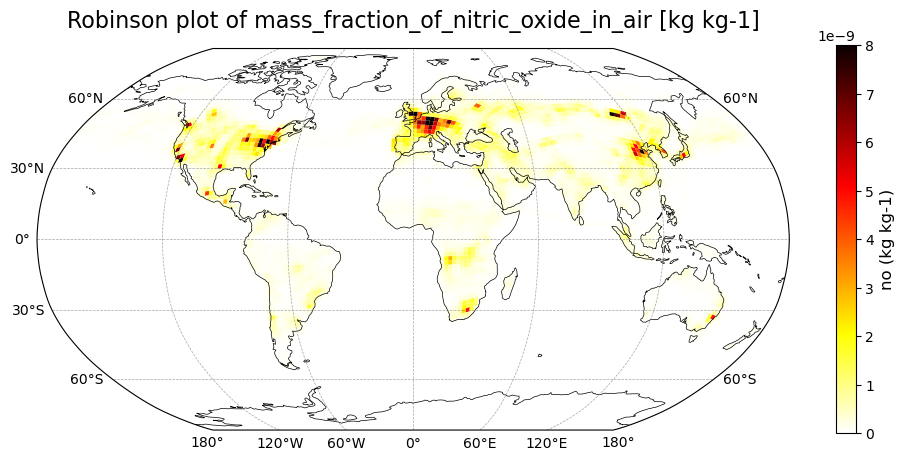
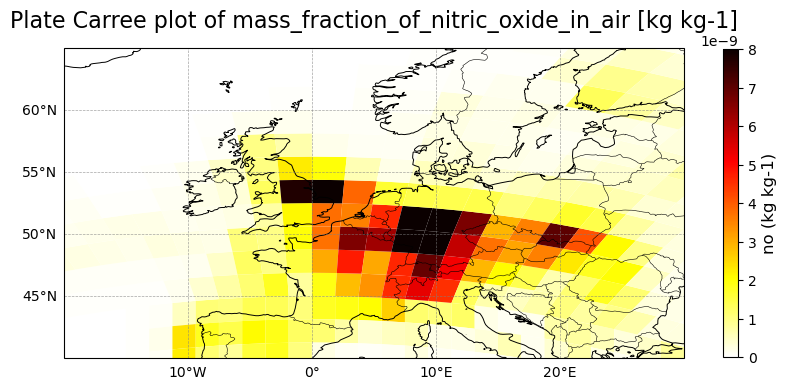
Exercise 2c: nitric oxide
- C48 nitric acid at the surface
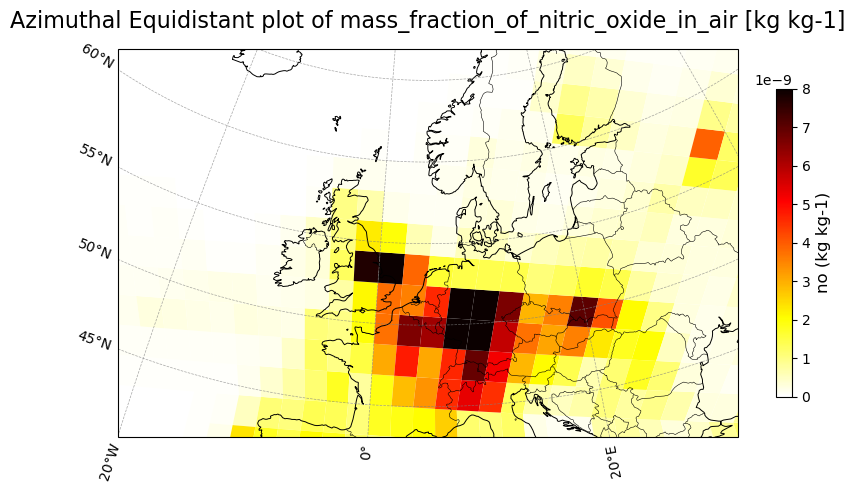


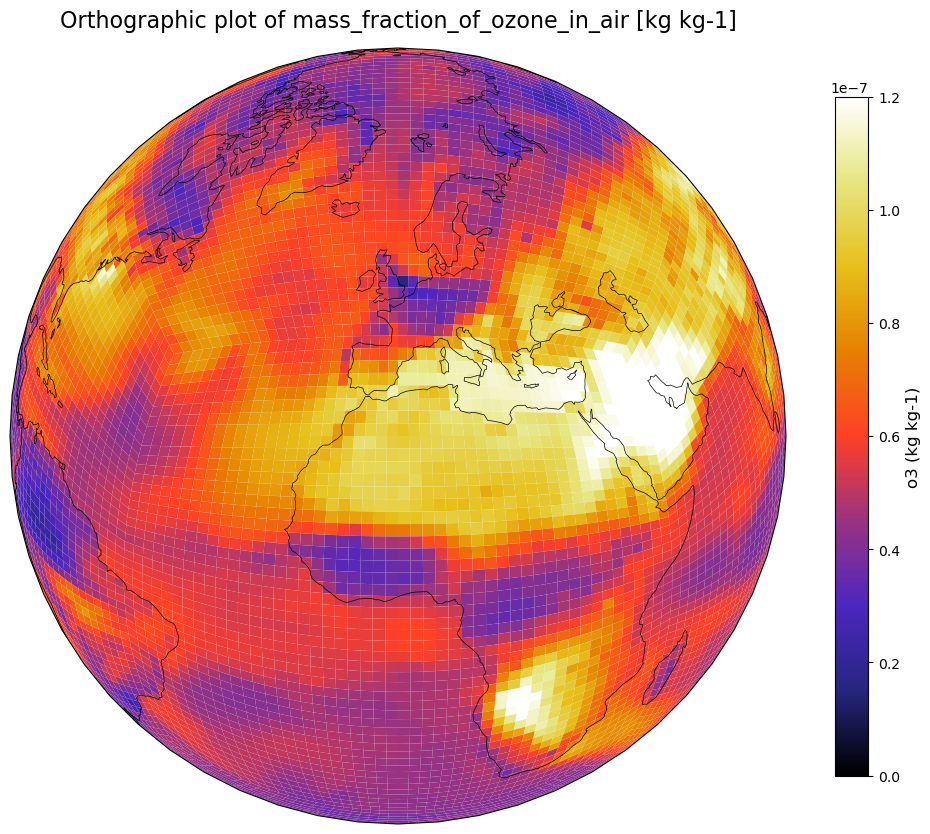
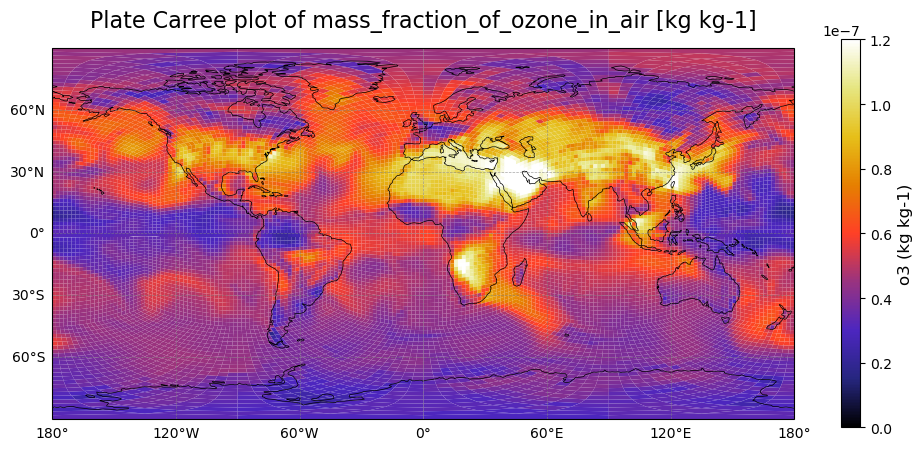
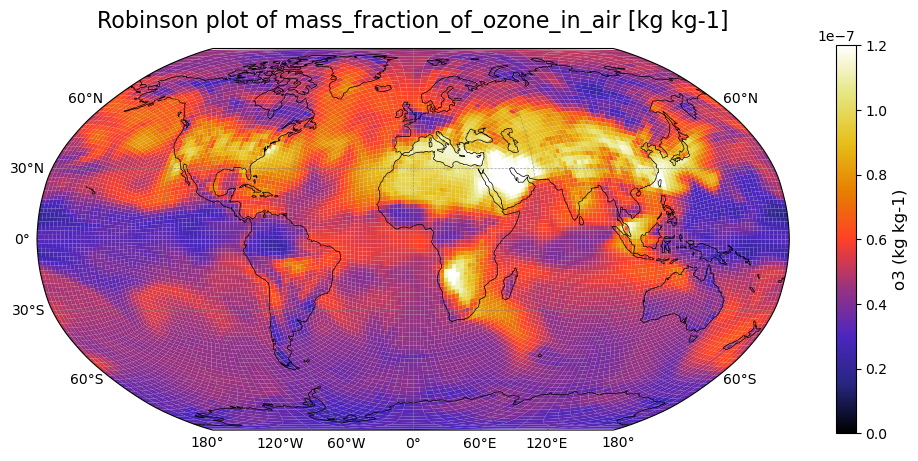
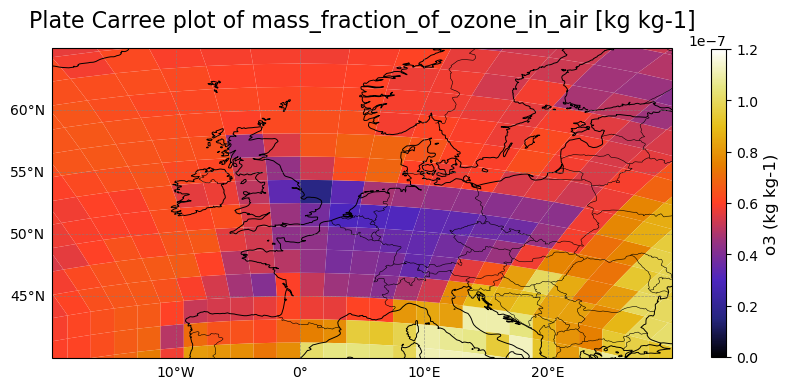
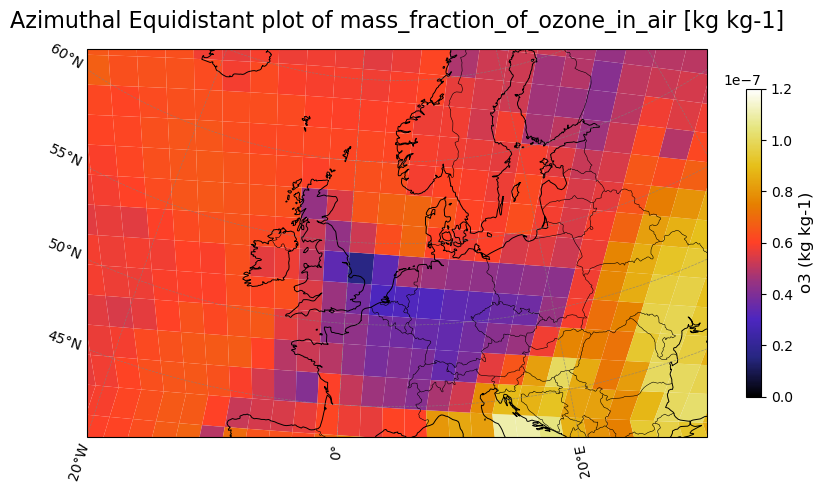
Exercise 2d: ozone
- C48 ozone at the surface


Further exercises
This script is currently set-up to plot the surface (level = 1), but you can also plot other levels.
UKCA Chemistry and Aerosol Tutorials at UMvn13.9
Written by Luke Abraham 2025.