Lead tracer
Lead Tracer
Dr. Fiona O'Connor, UK Met. Office.
The initial radon experiment with the inert lead tracer was extended to include a second lead tracer. The first lead tracer was treated as an inert tracer as before and the second lead tracer was subject to wet and dry deposition using the schemes in the tropospheric chemistry version of UKCA.
For dry deposition, the deposition velocities at 1 metre are prescribed as follows: 0.2 cm/s over land and 0.05 cm/s over the ocean (Balkanski et al. 1993). For wet deposition, the aerosols to which lead attaches itself were assumed to be very soluble and no variation in solubility was taken into account. Scavenging by convective and large-scale rainfall was treated as a first-order loss process according to Walton et al. (1988). The only differences in the treatment of convective and dynamic scavenging was in the scavenging coefficients (2.4 cm-1 for dynamic rainfall and 4.7 cm-1 for convective rainfall) and the fraction of the gridbox over which the rainfall occurs (f = 1.0 for dynamic rainfall and f = 0.3 for convective rainfall).
As before, the annual radon emission rate was 15 kg/year. Radon decays to lead with a half-life of 3.8 days. The non-inert lead tracer is then removed from the atmosphere by both wet and dry deposition as described above. The inert lead tracer simply accumulates and is transported around. Radioactive decay of lead (half-life = 22.3 years) is not taken into account. This experiment was also carried out using the Met Office's existing tropospheric chemistry model, STOCHEM.
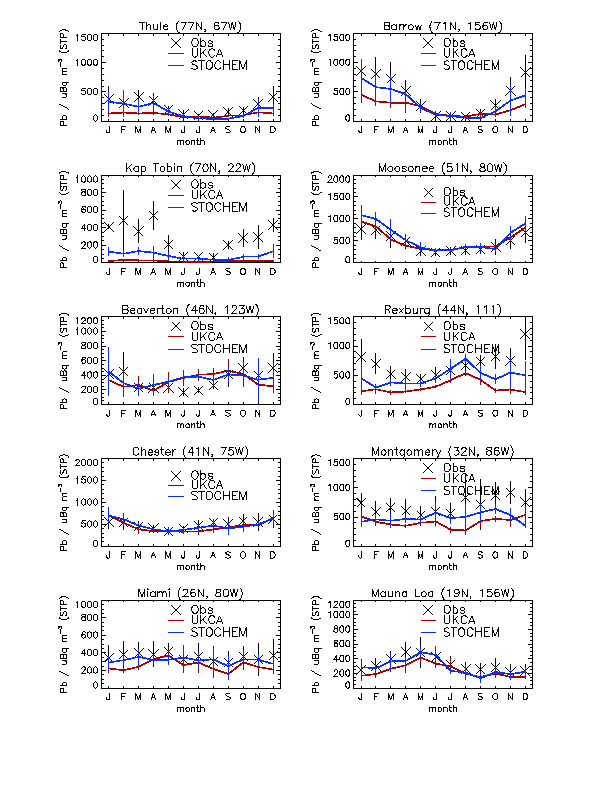
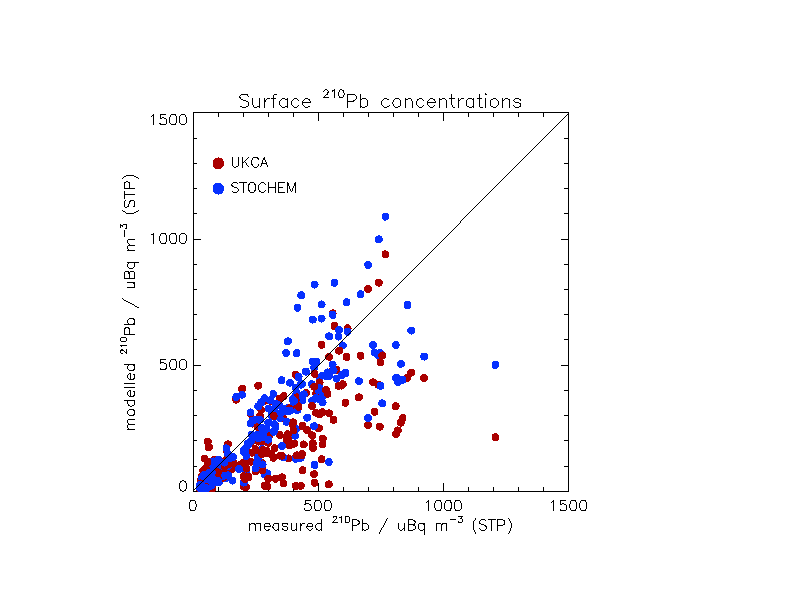
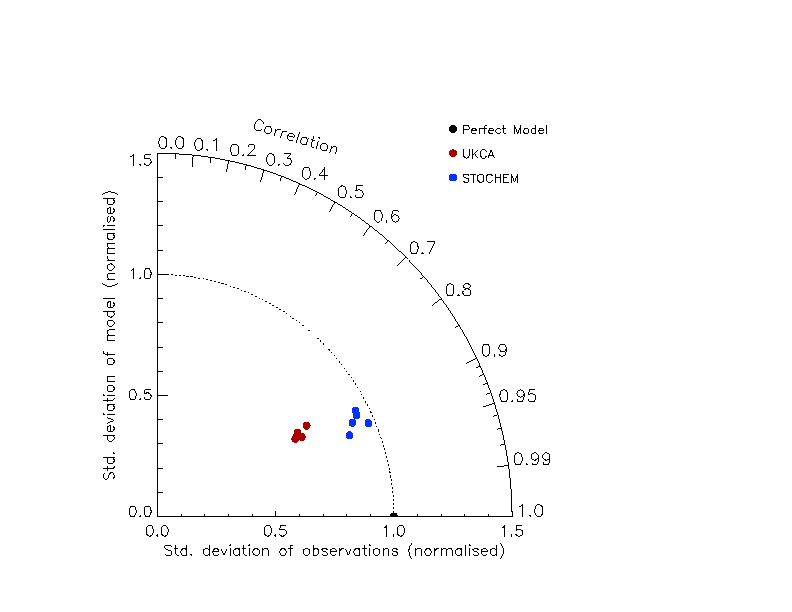
Comparisons of surface lead from UKCA and STOCHEM are compared with climatological observations. For this, observations were obtained at 20 global sites from the Surface Air Sampling Program database of the Environmental Measurements Laboratory (EML). Figure 1 shows a comparison of 5-year mean modelled (UKCA and STOCHEM) with measured surface lead concentrations for the 10 northern hemisphere stations. It indicates that both models capture the seasonal cycle and the absolute concentrations of surface lead reasonably well. The corresponding correlation plot can be seen in Figure 2; it suggests that UKCA surface lead concentrations are slightly underestimated relative to both the observations and STOCHEM. In order to do a more quantitative comparison, the use of a Taylor Diagram is adopted (see Figure 3). Each point represents the comparison of 1 model year with the observations and the different colours represent the two models. The angle the points make with the horizontal give an indication of the correlation coefficient between the model and the observations. The distance between the point and the origin is a measure of the ratio of the standard deviation of the model with that of the observations. If the standard deviation of the modelled concentrations is greater than that of the observations, the point will sit outside the dotted arc and vice versa. The diagram here indicates that the correlation coefficient associated with both models is high (of the order of 0.9-0.95). The standard deviation of the STOCHEM concentrations matches that of the observations more closely than UKCA. Therefore, the Taylor Diagram indicates that STOCHEM is outperforming UKCA in relation to the observed surface concentrations of lead.
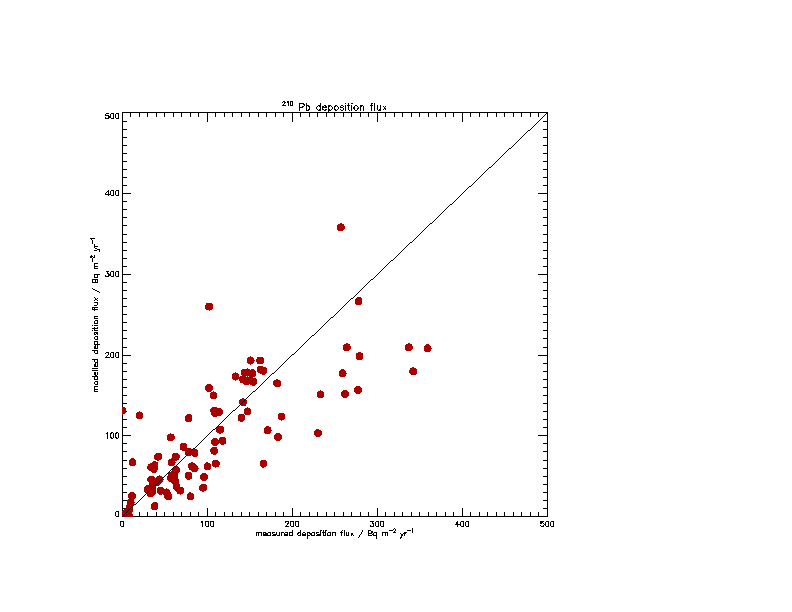
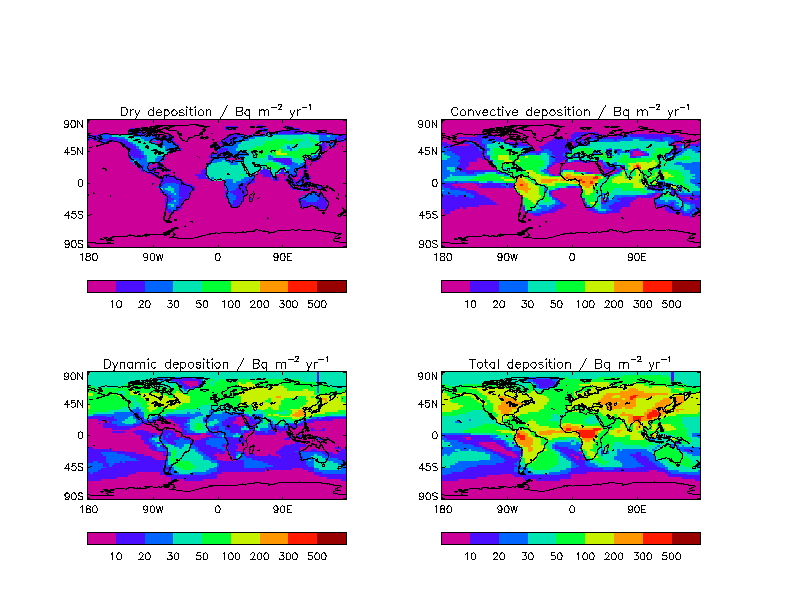
The 5 years of UKCA model output was used to obtain mean deposition fluxes at the surface. These are compared in Figure 4 with surface flux measurements compiled by Preiss and Genthon (1997). Although there is quite a bit of scatter about the 1:1 line, there is also a reasonable correlation between the modelled and measured surface fluxes. Finally, the deposition flux diagnostics output during the UKCA model integration were used to quantify the relative contributions of dry deposition, convective and dynamic scavenging to the total loss of lead. Figure 5 shows a plot of the global annual mean loss terms from each of the deposition processes in addition to the total deposition obtained from the 5 years of model output. It suggests that the contributions from the various processes were as follows: dry deposition 14.1%, convective scavenging 36.9%, and dynamic scavenging 48.9%. This is reasonably consistent with other studies.
