Difference between revisions of "NOy PEG"
| (50 intermediate revisions by the same user not shown) | |||
| Line 141: | Line 141: | ||
The model is still spinning up slightly from the initial condition. |
The model is still spinning up slightly from the initial condition. |
||
| + | |||
| + | All plots from this run can be found here: {{pdf|Base_xjcis.pdf|Base_xjcis.pdf}} |
||
===2. Doubled HNO3=== |
===2. Doubled HNO3=== |
||
| Line 151: | Line 153: | ||
The run was stop after only a few years as the HNO3 mass dropped rather quickly. The NOy mass also drops. |
The run was stop after only a few years as the HNO3 mass dropped rather quickly. The NOy mass also drops. |
||
| + | |||
| + | All plots from this run can be found here: {{pdf|HNO3x2_xjcit.pdf|HNO3x2_xjcit.pdf}} |
||
===3. No production or loss of any NOy species=== |
===3. No production or loss of any NOy species=== |
||
| Line 163: | Line 167: | ||
All plots from this run can be found here: {{pdf|NoSourceSink_xjciv.pdf|NoSourceSink_xjciv.pdf}} |
All plots from this run can be found here: {{pdf|NoSourceSink_xjciv.pdf|NoSourceSink_xjciv.pdf}} |
||
| + | |||
| + | Alex has also done some additional analysis: {{pdf|Xjciv_NOy_chem.pdf|Xjciv_NOy_chem.pdf}} |
||
===4. No calls to any UKCA routines=== |
===4. No calls to any UKCA routines=== |
||
| Line 185: | Line 191: | ||
As well as showing that the emission_ctl routine isn't causing the problem, this also shows that it isn't coming from boundary layer mixing, either, as this is done in emission_ctl for the section 34 (UKCA) tracers. |
As well as showing that the emission_ctl routine isn't causing the problem, this also shows that it isn't coming from boundary layer mixing, either, as this is done in emission_ctl for the section 34 (UKCA) tracers. |
||
| + | |||
| + | All plots from this run can be found here: {{pdf|EmsOnly_xkqhc.pdf|EmsOnly_xkqhc.pdf}} |
||
===6. Call to transform_halogen and transform_nitrogen only=== |
===6. Call to transform_halogen and transform_nitrogen only=== |
||
| Line 206: | Line 214: | ||
[[Image:TransChemOnly_NOy.png|400px]] |
[[Image:TransChemOnly_NOy.png|400px]] |
||
| − | There should be changes to the NOy species, which may involve them increasing or decreasing during the course of the run. |
+ | There should be changes to the NOy species, which may involve them increasing or decreasing during the course of the run. |
| + | All plots from this run can be found here: {{pdf|TransChemOnly_xkqhe.pdf|TransChemOnly_xkqhe.pdf}} |
||
| − | As there is no photolysis or emissions, the evolution is different from the original ''no sources or sinks'' run. This implies that the problem is in chemistry_ctl, or in the combination of chemistry_ctl '''and''' transform_nitrogen. |
||
| − | |||
| − | Looking at the figures below for NOy and N2O5 in more detail, it appears that the drop in both is highly correlated (after the first few months), more-so than with other species. Note the different scales on the y-axis. |
||
| − | |||
| − | Also, the initial mass of NOy seems around 25% higher in this run than in the other runs, despite the fact that they all started from the same initial condition. It is unclear why the value is higher here. |
||
| − | |||
| − | [[Image:Xkhqe_NOy.png|400px]][[Image:Xkhqe_N2O5.png|400px]] |
||
===8. Call to transform_halogen and chemistry_ctl only=== |
===8. Call to transform_halogen and chemistry_ctl only=== |
||
| Line 224: | Line 226: | ||
[[Image:ChemOnly_NOy.png|400px]] |
[[Image:ChemOnly_NOy.png|400px]] |
||
| − | As above (xkqhe), there should be changes to the NOy species, which may involve them increasing or decreasing during the course of the run. |
+ | As above (xkqhe), there should be changes to the NOy species, which may involve them increasing or decreasing during the course of the run. |
| − | |||
| − | As there is no photolysis or emissions, the evolution is different from the original ''no sources or sinks'' run. Given that transform_nitrogen is not called in this run, this implies that the problem is in chemistry_ctl alone, and is not associated with photolysis. |
||
| − | |||
| − | Looking at the figures below for NOy and N2O5 in more detail, it appears that the drop in both is still highly correlated (after the first few months), more-so than with other species. Note the different scales on the y-axis. |
||
| − | |||
| − | Also, the initial mass of NOy still seems around 25% higher in this run than in the other runs, despite the fact that they all started from the same initial condition. It is unclear why the value is higher here, but it is not associated with transform_nitrogen. |
||
| − | |||
| − | [[Image:Xkhqf_NOy.png|400px]][[Image:Xkhqf_N2O5.png|400px]] |
||
All plots can be found here: {{pdf|ChemOnly_xkqhf.pdf|ChemOnly_xkqhf.pdf}} |
All plots can be found here: {{pdf|ChemOnly_xkqhf.pdf|ChemOnly_xkqhf.pdf}} |
||
| Line 241: | Line 235: | ||
[[Image:NoTrimol_NOy.png|400px]] |
[[Image:NoTrimol_NOy.png|400px]] |
||
| − | |||
| − | [[Image:Xkhqg_NOy.png|400px]][[Image:Xkhqg_N2O5.png|400px]] |
||
All plots from this run can be found here: {{pdf|NoTrimol_xkqhg.pdf|NoTrimol_xkqhg.pdf}} |
All plots from this run can be found here: {{pdf|NoTrimol_xkqhg.pdf|NoTrimol_xkqhg.pdf}} |
||
| Line 251: | Line 243: | ||
[[Image:NoHetero_NOy.png|400px]] |
[[Image:NoHetero_NOy.png|400px]] |
||
| − | |||
| − | [[Image:Xkqhh_NOy.png|400px]][[Image:Xkqhh_N2O5.png|400px]] |
||
All plots from this run can be found here: {{pdf|NoHetero_xkqhh.pdf|NoHetero_xkqhh.pdf}} |
All plots from this run can be found here: {{pdf|NoHetero_xkqhh.pdf|NoHetero_xkqhh.pdf}} |
||
| Line 261: | Line 251: | ||
[[Image:NoWetDep_NOy.png|400px]] |
[[Image:NoWetDep_NOy.png|400px]] |
||
| − | |||
| − | [[Image:Xkqhi_NOy.png|400px]][[Image:Xkqhi_N2O5.png|400px]] |
||
All plots from this run can be found here: {{pdf|NoWetDep_xkqhi.pdf|NoWetDep_xkqhi.pdf}} |
All plots from this run can be found here: {{pdf|NoWetDep_xkqhi.pdf|NoWetDep_xkqhi.pdf}} |
||
| Line 271: | Line 259: | ||
[[Image:NoDryDep_NOy.png|400px]] |
[[Image:NoDryDep_NOy.png|400px]] |
||
| − | |||
| − | [[Image:Xkqhj_NOy.png|400px]][[Image:Xkqhj_N2O5.png|400px]] |
||
All plots from this run can be found here: {{pdf|NoDryDep_xkqhj.pdf|NoDryDep_xkqhj.pdf}} |
All plots from this run can be found here: {{pdf|NoDryDep_xkqhj.pdf|NoDryDep_xkqhj.pdf}} |
||
| Line 286: | Line 272: | ||
The latter two should give equivalent results, assuming that there is no overwriting being done in asad_bimol or asad_trimol. |
The latter two should give equivalent results, assuming that there is no overwriting being done in asad_bimol or asad_trimol. |
||
| + | |||
| + | ===New Results=== |
||
| + | |||
| + | A number of others tests were run, listed below. When plotting these, it was realised that the NO2 contribution had not been included in the original plots above - this has now been corrected. |
||
| + | |||
| + | ===13. No call to conserve=== |
||
| + | |||
| + | A copy of xjciv was taken (including the doubled HNO3 initial condition). The call to the conserve routine was removed. This is job '''xkqha'''. |
||
| + | |||
| + | [[Image:NoConserve_NOy.png|400px]] |
||
| + | |||
| + | All plots from this run can be found here: {{pdf|NoConserve_xkqha.pdf|NoConserve_xkqha.pdf}} |
||
| + | |||
| + | ===14. NOy interconversion reaction rates set to zero=== |
||
| + | |||
| + | A copy of xjciv was taken (including the doubled HNO3 initial condition). The rates of all NOy interconversion reactions in ukca_chem_strattrop were set to zero. This is job '''xlbqa'''. |
||
| + | |||
| + | [[Image:RatesToZero_NOy.png|400px]] |
||
| + | |||
| + | All plots from this run can be found here: {{pdf|RatesToZero_xlbqa.pdf|RatesToZero_xlbqa.pdf}} |
||
| + | |||
| + | One of the dependent reactions was still in place, but this does not affect the NOy conservation. |
||
| + | |||
| + | ===15. NOy interconversion reactions removed=== |
||
| + | |||
| + | A copy of xjciv was taken (including the doubled HNO3 initial condition). All NOy interconversion reactions in ukca_chem_strattrop were removed. This is job '''xlbqb'''. |
||
| + | |||
| + | [[Image:RatesRemoved_NOy.png|400px]] |
||
| + | |||
| + | All plots from this run can be found here: {{pdf|RatesRemoved_xlbqb.pdf|RatesRemoved_xlbqb.pdf}} |
||
| + | |||
| + | Zonal-mean tendency plots can be found here: {{pdf|RatesRemoved_xlbqb_NOy_UKCA_tendency.pdf|RatesRemoved_xlbqb_NOy_UKCA_tendency.pdf}} |
||
| + | |||
| + | ===16. Rates of NOy bimolecular interconversion reactions were set to zero=== |
||
| + | |||
| + | A copy of xjciv was taken (including the doubled HNO3 initial condition). All NOy bimolecular interconversion reactions in ukca_chem_strattrop were set to zero (i.e. there were only termolecular reactions). This is job '''xlbqd'''. |
||
| + | |||
| + | [[Image:BimolZero_NOy.png|400px]] |
||
| + | |||
| + | All plots from this run can be found here: {{pdf|BimolZero_xlbqd.pdf|BimolZero_xlbqd.pdf}} |
||
| + | |||
| + | ===17. Rates of NOy bimolecular interconversion reactions were set to zero and the special reactions were removed=== |
||
| + | |||
| + | A copy of xjciv was taken (including the doubled HNO3 initial condition). All NOy bimolecular interconversion reactions in ukca_chem_strattrop were set to zero (i.e. there were only trimolecular reactions) and the special trimolecular reactions in asad_trimol were removed. This is job '''xlbqf'''. |
||
| + | |||
| + | [[Image:BimolZeroNoDep_NOy.png|400px]] |
||
| + | |||
| + | All plots from this run can be found here: {{pdf|BimolZeroNoDep_xlbqf.pdf|BimolZeroNoDep_xlbqf.pdf}} |
||
| + | |||
| + | ===18. Rates of NOy trimolecular interconversion reactions were set to zero=== |
||
| + | |||
| + | A copy of xjciv was taken (including the doubled HNO3 initial condition). All NOy trimolecular interconversion reactions in ukca_chem_strattrop were set to zero (i.e. there were only bimolecular reactions). This is job '''xlbqc'''. |
||
| + | |||
| + | [[Image:TrimolZero_NOy.png|400px]] |
||
| + | |||
| + | All plots from this run can be found here: {{pdf|TrimolZero_xlbqc.pdf|TrimolZero_xlbqc.pdf}} |
||
| + | |||
| + | ===19. Rates of NOy trimolecular interconversion reactions were set to zero and the NOy special reactions were removed=== |
||
| + | |||
| + | A copy of xjciv was taken (including the doubled HNO3 initial condition). All NOy trimolecular interconversion reactions in ukca_chem_strattrop were set to zero (i.e. there were only bimolecular reactions) and the special bimolecular reactions in asad_bimol were removed. This is job '''xlbqe'''. |
||
| + | |||
| + | [[Image:TrimolZeroNoDep_NOy.png|400px]] |
||
| + | |||
| + | All plots from this run can be found here: {{pdf|TrimolZeroNoDep_xlbqe.pdf|TrimolZeroNoDep_xlbqe.pdf}} |
||
| + | |||
| + | ===20. Solver and timestep changes=== |
||
| + | |||
| + | A copy of xjciv was taken (including the doubled HNO3 initial condition). The chemical timestep was changed to 20 minutes (rather than 1 hour), the value of rafeps was made smaller and maxneg was set to zero. This is job '''xlbqg'''. |
||
| + | |||
| + | [[Image:SolverChanges_NOy.png|400px]] |
||
| + | |||
| + | All plots from this run can be found here: {{pdf|SolverChanges_xlbqg.pdf|SolverChanges_xlbqg.pdf}} |
||
| + | |||
| + | ===Further xjciv analysis=== |
||
| + | |||
| + | ATA has performed further analysis on the [[#3._No_production_or_loss_of_any_NOy_species|xjciv]] simulation (where the production and loss of NOy was removed) looking at the zonal-mean loss rate of NOy. The results are very interesting: |
||
| + | |||
| + | * {{pdf|Xjciv_NOy_chem.pdf|Xjciv_NOy_chem.pdf}} |
||
| + | |||
| + | These point to a tropospheric loss, possibly associated with aerosol? |
||
| + | |||
| + | [[Image:Xjciv_NOy_chem_p12.png|400px]] |
||
| + | |||
| + | ===Summary of runs to date=== |
||
| + | |||
| + | The following plot gives a summary of the runs to date, with the initial value of NOy also included. |
||
| + | |||
| + | [[Image:AllNOy_20.png|400px]] |
||
| + | |||
| + | ===Tests planned=== |
||
| + | |||
| + | Following the teleconference on 2015-03-03, the following further tests/analysis were suggested: |
||
| + | |||
| + | Present: Luke Abraham (LA), Alex Archibald (AA), John Pyle (JP), Paul Griffiths (PG), James Keeble (JK), Martyn Chipperfield (MC), Sandip Dhomse (SD), Fiona O'Connor (FOC). |
||
| + | |||
| + | * Make sure asad_hetero is not called |
||
| + | * Check for any processes at 19km - extremely useful given the fact that the losses seem to occur below this height |
||
| + | * Do the zonal-mean diagnostics again for expt 15. |
||
| + | * Check the N2O5+M reaction in asad_trimol |
||
| + | * Either Build up NOy complexity from the ground up or try removing various NOy species (and associated reactions) from the solver instead |
||
| + | ** it was decided to do 3 runs: |
||
| + | **# remove N2O5 |
||
| + | **# remove HONO2 |
||
| + | **# remove both N2O5 and HONO2 |
||
| + | * SD may be able to look at Zonal mean plots |
||
| + | * LA to set up a doodle poll for Mon 23rd/Tue 24th - '''done:''' http://doodle.com/zc2zguhgitatd7az |
||
| + | |||
| + | ===Role of TR_MIX=== |
||
| + | |||
| + | Two short test jobs were run: '''xlbqh''' which includes the call to TR_MIX; and '''xlbqi''' which had the calls to TR_MIX commented out. |
||
| + | |||
| + | These runs were based on '''xlbqb''' ([[#15._NOy_interconversion_reactions_removed|expt. 15]]) which had the NOy reactions removed from the chemistry specification. |
||
| + | |||
| + | A lot of the structure in the troposphere, and the hard-line at ~17km/level 50 comes from this call to TR_MIX. |
||
| + | |||
| + | [[Image:Xlbqh_NOy_UKCA_tendency_2005-12-01_122000.png|400px|Call to TR_MIX included]] |
||
| + | [[Image:Xlbqi_NOy_UKCA_tendency_2005-12-01_122000.png|400px|Call to TR_MIX commented out]] |
||
| + | |||
| + | ===21. TR_MIX and ASAD_HETERO not called=== |
||
| + | |||
| + | A copy of xjciv was taken (including the doubled HNO3 initial condition). The calls to TR_MIX and ASAD_HETERO were removed. This is job '''xlbqm'''. |
||
| + | |||
| + | [[Image:NoTRMIX_NOy.png|400px]] |
||
| + | |||
| + | All plots from this run can be found here: {{pdf|NoTRMIX_xlbqm.pdf|NoTRMIX_xlbqm.pdf}} |
||
| + | |||
| + | Zonal-mean tendency plots can be found here: {{pdf|NoTRMIX_xlbqm_NOy_UKCA_tendency.pdf|NoTRMIX_xlbqm_NOy_UKCA_tendency.pdf}} |
||
| + | |||
| + | ===22. N2O5 reactions removed=== |
||
| + | |||
| + | A copy of xlbqm was taken (including the doubled HNO3 initial condition). All remaining reactions involving N2O5 were removed. This is job '''xlbqj'''. |
||
| + | |||
| + | [[Image:NoN2O5_NOy.png|400px]] |
||
| + | |||
| + | All plots from this run can be found here: {{pdf|NoN2O5_xlbqj.pdf|NoN2O5_xlbqj.pdf}} |
||
| + | |||
| + | Zonal-mean tendency plots can be found here: {{pdf|NoN2O5_xlbqj_NOy_UKCA_tendency.pdf|NoN2O5_xlbqj_NOy_UKCA_tendency.pdf}} |
||
| + | |||
| + | ===23. HNO3 reactions removed=== |
||
| + | |||
| + | A copy of xlbqm was taken (including the doubled HNO3 initial condition). All remaining reactions involving HNO3 were removed. This is job '''xlbqk'''. |
||
| + | |||
| + | [[Image:NoHONO2_NOy.png|400px]] |
||
| + | |||
| + | All plots from this run can be found here: {{pdf|NoHONO2_xlbqk.pdf|NoHONO2_xlbqk.pdf}} |
||
| + | |||
| + | Zonal-mean tendency plots can be found here: {{pdf|NoHONO2_xlbqk_NOy_UKCA_tendency.pdf|NoHONO2_xlbqk_NOy_UKCA_tendency.pdf}} |
||
| + | |||
| + | ===24. N2O5 and HNO3 reactions removed=== |
||
| + | |||
| + | A copy of xlbqm was taken (including the doubled HNO3 initial condition). All remaining reactions involving N2O5 and HNO3 were removed. This is job '''xlbql'''. |
||
| + | |||
| + | [[Image:NoN2O5orHONO2_NOy.png|400px]] |
||
| + | |||
| + | All plots from this run can be found here: {{pdf|NoN2O5orHONO2_xlbql.pdf|NoN2O5orHONO2_xlbql.pdf}} |
||
| + | |||
| + | Zonal-mean tendency plots can be found here: {{pdf|NoN2O5orHONO2_xlbql_NOy_UKCA_tendency.pdf|NoN2O5orHONO2_xlbql_NOy_UKCA_tendency.pdf}} |
||
| + | |||
| + | ===Comparison of xjciv, xlbqm, xlbqj, xlbqk, & xlbql=== |
||
| + | |||
| + | [[Image:AllNOy_N2O5HONO2.png|400px]] |
||
| + | |||
| + | ===Tracers totals after various UKCA routines=== |
||
| + | |||
| + | The images below show output from '''xlbqo''' (a copy of xlbqm: no TR_MIX or ASAD_HETERO) which includes a <code>UKCA_DEBUG_TRACERS</code> routine, which can diagnose the change in UKCA chemical tracers due to each suboutine (or the rest of the UM as a whole): |
||
| + | |||
| + | [[Image:Ukca_debug_tracers.png|400px]][[Image:xlbqo_ukca_debug_tracers.png|400px]] |
||
| + | |||
| + | Lines are for NOy unless otherwise stated. |
||
| + | |||
| + | The images below show how the various NOy species are affected by <code>UKCA_CHEMISTRY_CTL</code>: |
||
| + | |||
| + | [[Image:Chem_debug_tracers.png|400px]][[Image:Xlbqo_chem_debug_tracers.png|400px]] |
||
| + | |||
| + | Note that these show the change global total mass of each tracer. Information is available for all tracers, in kg and in % change. The first image in each set are just for the 1st day of the run, the second is for |
||
| + | around 8.5 days of run (the <code>UKCA_DEBUG_TRACERS</code> slows the model down considerably, so this run hit the 3-hour wallclock limit). |
||
| + | |||
| + | ===Suggested Further Tests (2015-04-13)=== |
||
| + | |||
| + | # Adjust the above % change plots by having a ''MetUM'', ''UKCA_CHEMISTRY_CTL'' and ''"the bit between the MetUM and UKCA_CHEMISTRY_CTL"'' and ''"the bit between UKCA_CHEMISTRY_CTL and the MetUM"''. |
||
| + | # Extend the <code>UKCA_DEBUG_TRACERS</code> routine so that it can work around all the different subroutines called from within <code>UKCA_CHEMISTRY_CTL</code> (possibly an <code>ASAD_DEBUG_TRACERS</code>). This will probably have to contain level-by-level information due to the way ASAD is called. |
||
| + | # Repeat the tests which commented out the various types of reactions (and also extend this to individual reactions) and run these with these <code>DEBUG_TRACERS</code> routines on to try to assess the impact of each reaction type. |
||
| + | |||
| + | ===25. N2O5+H2O->2HNO3 reaction removed=== |
||
| + | |||
| + | A copy of xlbqm was taken (including the doubled HNO3 initial condition). All the reaction <math>N_{2}O_{5} + H_{2}O \rightarrow 2HNO_{3}</math> was removed. The only two reactions that remain are: |
||
| + | |||
| + | : <math>NO_{2} + NO_{3} \rightarrow N_{2}O_{5} + m</math> |
||
| + | : <math>N_{2}O_{5} + m \rightarrow NO_{2} + NO_{3}</math> |
||
| + | |||
| + | This is job '''xlbqn'''. |
||
| + | |||
| + | [[Image:NoB085_NOy.png|400px]] |
||
| + | |||
| + | All plots from this run can be found here: {{pdf|NoB085_xlbqn.pdf|NoB085_xlbqn.pdf}} |
||
| + | |||
| + | Zonal-mean tendency plots can be found here: {{pdf|NoB085_xlbqn_NOy_UKCA_tendency.pdf|NoB085_xlbqn_NOy_UKCA_tendency.pdf}} |
||
| + | |||
| + | The comparison plot has also been updated, showing the impact of this reaction's removal as compared to the more recent tests. |
||
| + | |||
| + | [[Image:AllNOy_B085.png|400px]] |
||
| + | |||
| + | ===NOy telecon minutes 2015-04-14 2pm-3pm=== |
||
| + | |||
| + | Present: LA, JP, PG, AA, JK, MC |
||
| + | |||
| + | Please see also the results of the B085 reaction |
||
| + | |||
| + | : <math>N_{2}O_{5} + H_{2}O \rightarrow 2HNO_{3}</math> |
||
| + | |||
| + | being removed above (test 24), which were only added after the meeting. |
||
| + | |||
| + | Suggestions: |
||
| + | |||
| + | # Check effects of TR_MIX and ASAD_HETERO independently (c.f. xlbqm - blue line). |
||
| + | # Try changing the rates of the fast N2O5 termolecular reactions to slow them down and seeing what effect this has. |
||
| + | # Put the UKCA_DEBUG_TRACERS call around the UKCA_TRANSFORM_NITROGEN routine. |
||
| + | # Try comparing (e.g. the zonal-mean tendencies) to another, separate tracer, e.g. CH4, with the prod and loss reactions changed accordingly. |
||
| + | #* This may need to be tested with a pair of interconverted tracers. |
||
| + | # Create ZM plots showing mass/moles of NOy, to find where it is most abundant. |
||
| + | # Double-check how the zonal-mean tendencies are calculated, and make sure that there aren't any mistakes. |
||
| + | # Change the N2O5 termolecular reactions to: |
||
| + | #:: <math>N_{2} + O_{2} \rightarrow N_{2}O_{5} + m</math> |
||
| + | #:: <math>N_{2}O_{5} + m \rightarrow N_{2} + O_{2}</math> |
||
| + | #: with the rates adjusted accordingly. Do this in a run which has B085 removed, leaving these as the only N2O5 reactions and then compare to xlbqn. |
||
| + | # Look into what debugging settings/options are available in the solver. |
||
| + | # Redo the Base run (xjcis) to remove all the N2O5 reactions and see how this looks. |
||
| + | |||
| + | MC suggested that we should try to not lose sight of the original problem. It would be a good idea for the Base run (xjcis) to be included in all comparison plots, as well as bringing suggested ideas back to be run in the Base (c.f. xjcis) configuration. |
||
| + | |||
| + | ===26. N2O5 reactions/deposition removed from Base simulation=== |
||
| + | |||
| + | A copy of xjcis was taken. All the reactions involving N2O5 were removed, as was N2O5 deposition. This is job '''xlbqp'''. |
||
| + | |||
| + | [[Image:BaseNoN2O5_NOy.png|400px]] |
||
| + | |||
| + | All plots from this run can be found here: {{pdf|BaseNoN2O5_xlbqp.pdf|BaseNoN2O5_xlbqp.pdf}} |
||
| + | |||
| + | Zonal-mean tendency plots can be found here: {{pdf|BaseNoN2O5_xlbqp_NOy_UKCA_tendency.pdf|BaseNoN2O5_xlbqp_NOy_UKCA_tendency.pdf}} |
||
| + | |||
| + | The comparison plot has also been updated, showing the impact of this reaction's removal as compared to the more recent tests. |
||
| + | |||
| + | [[Image:AllNOy_BaseNoN2O5.png|400px]] |
||
| + | |||
| + | ===27. No call to ASAD_BIMOL=== |
||
| + | |||
| + | A copy of xjciv was taken and the interactive O3 was turned off. The calculation of t300 was moved from <code>asad_bimol</code> to <code>asad_cdrive</code> where the call to <code>asad_bimol</code> was also commented out. This is job '''xlbqr'''. |
||
| + | |||
| + | [[Image:NoBimol_NOy.png|400px]] |
||
| + | |||
| + | All plots from this run can be found here: {{pdf|NoBimol_xlbqr.pdf|NoBimol_xlbqr.pdf}} |
||
| + | |||
| + | Zonal-mean tendency plots can be found here: {{pdf|NoBimol_xlbqr_NOy_UKCA_tendency.pdf|NoBimol_xlbqr_NOy_UKCA_tendency.pdf}} |
||
| + | |||
| + | ===Flowchart=== |
||
| + | |||
| + | A flowchart showing how the jobs are related is shown below. |
||
| + | |||
| + | [[Image:Jobs_FlowChart.png|400px]] |
||
| + | |||
| + | '''Key''' |
||
| + | * <span style="background:red;color:white">Red</span>: loss of NOy observed |
||
| + | * <span style="background:orange;color:white">Orange</span>: loss of NOy not observed, but underlying problem may still exist |
||
| + | * <span style="background:green;color:white">Green</span>: loss of NOy not observed |
||
| + | |||
| + | This is also available as a .pdf: {{pdf|Jobs_FlowChart.pdf|Jobs_FlowChart.pdf}} |
||
| + | |||
| + | ===Suggested Further Tests 2015-05-19=== |
||
| + | |||
| + | Following a meeting of LA, JP, AA, PG, & JK, the following tests were suggested: |
||
| + | |||
| + | # Copy xiciv: |
||
| + | ## Turn off TR_MIX |
||
| + | ## Turn off ASAD_HETERO |
||
| + | # Check solver initialisation and try initialising every timestep |
||
| + | # Set NOy to zero from all bar one block in ukca_chem_strattop and run (~5 runs) |
||
Latest revision as of 15:02, 19 May 2015
vn7.3 vs. vn8.4
While UKCA had low NOy at vn7.3, this feature has not improved when moving to vn8.2/vn8.4 GA4.0 jobs, and may even have become worse.
A pair of simulations have been set-up to try to aid the diagnosis of the cause of this low NOy. While there have been many changes to the base atmospheric model, the differences between the UKCA chemistry scheme used have been minimised.
- All surface and aircraft chemical emissions are the same between both jobs, and are year 2000 climatologies
- The SST/Sea-Ice ancillaries are daily means from the Reynolds dataset, and are meaned over 1995-2005
- All chemical reactions and associated rates are the same between both jobs
- The GHGs and tracer lower boundary conditions are the same for both jobs
- 2000-12-01 from the CCMI REF-C2 specification taking WMO2011 values for ODSs and following the historical values for GHGs from the RCP scenarios defined for CMIP5
- The initial conditions of the chemical species are the same for both jobs, originally taken from a vn7.3 job. The winds and other physical initial conditions are different however
- Radiative feedback from O3 is included in both jobs
- vn8.4 job also considers radiative feedback from aerosols
- The same lightning NOx routine were used by both models, and these were scaled to give approximately the same annual emissions
NOTE: While the vn8.4 job does include GLOMAP-mode aerosols and some extra associated chemical reactions, the low NOy has also been observed in the vn8.2 CheST (only) configuration.
Results
| VN7.3 | VN8.4 | VN7.3 | |
| MONSooN jobid | xjcir | xjcin | xgywn |
| Configuration | HadGEM3-A r2.0 | HadGEM3-A GA4.0 | HadGEM3-A r2.0 (ish) |
| Resolution | N48L60 | N96L85 | N48L60 |
| UKCA scheme | CheST | CheST+GLOMAP | CheST |
| Model set-up | TS2000 | TS2000 | TS2000 |
| Evaluation Suite Output (Chemistry) |
|
| |
| Evaluation Suite Output (Aerosol) |
N/A |
| |
| NOy species time evolution | |||
| Comparison with SLIMCAT | |||
| Stratospheric Flux Analyis | |||
| Lightning NOx |
year 01 4.31451 Tg(N)/year |
year 01 3.93965 Tg(N)/year |
NB The stratospheric analysis pdf file contains a table of the annual sum throughout the stratosphere (moles /yr) for all reactions that produce or destroy a chemical species in the run. The pdf is sorted alphabetically (Br first PPAN at the end).
Minutes from meeting 2014-02-13
- Present
- Luke Abraham (NLA), Alex Archibald, James Keeble (JMK), Sandip Dhomse, Paul Griffiths, Martyn Chipperfield, John Pyle, Fiona O'Connor (skype)
- Further experiments suggested
- Change how the NOy species are treated: removed these from transform_halogen and make a new routine which also requires NO2 to be transported. The NOy (i.e. Lumped N) tracer is also advected and this is used as a test against the calculated NOy field from the individual species. Using this comparison the NOy species can be rescaled according to the ratio of and . BrONO2 and ClONO2 should not be rescaled as this would change the Cl and Br species. A diagnostic check on the differences between and should be done, as well as possibly checking for global conservation during transport. The NALD tracer is not currently included and should be. (NLA to do)
- Further to the above, try turning off all other processes and check the advection over a short run. Other steps could then be added piecewise to see their effects.
- Check that N2O5 is not causing any problems by setting its rates to zero and set it to no_change in transform_halogen (JMK to do)
Sensitivity tests
NLA has performed several sensitivity tests following the meeting and the recommendations above.
Note that for the plots below, NOy was calculated by summing up all the other species in post-processing.
An example of the problem is:
Changes required to below plots
The plots below are rather confusing, and there are a lot of them. The following changes will be made, but unfortunately not for the teleconference on the 15th December:
- Change the units so that all species are plotted in kg(N). Currently all plots are in kg(Species) except for NOy.
- Include the initial value from the .astart file in the plots, to give the initial condition. This should highlight some of the strange behaviour in NOy.
The results from these tests are:
1. transform_nitrogen routine
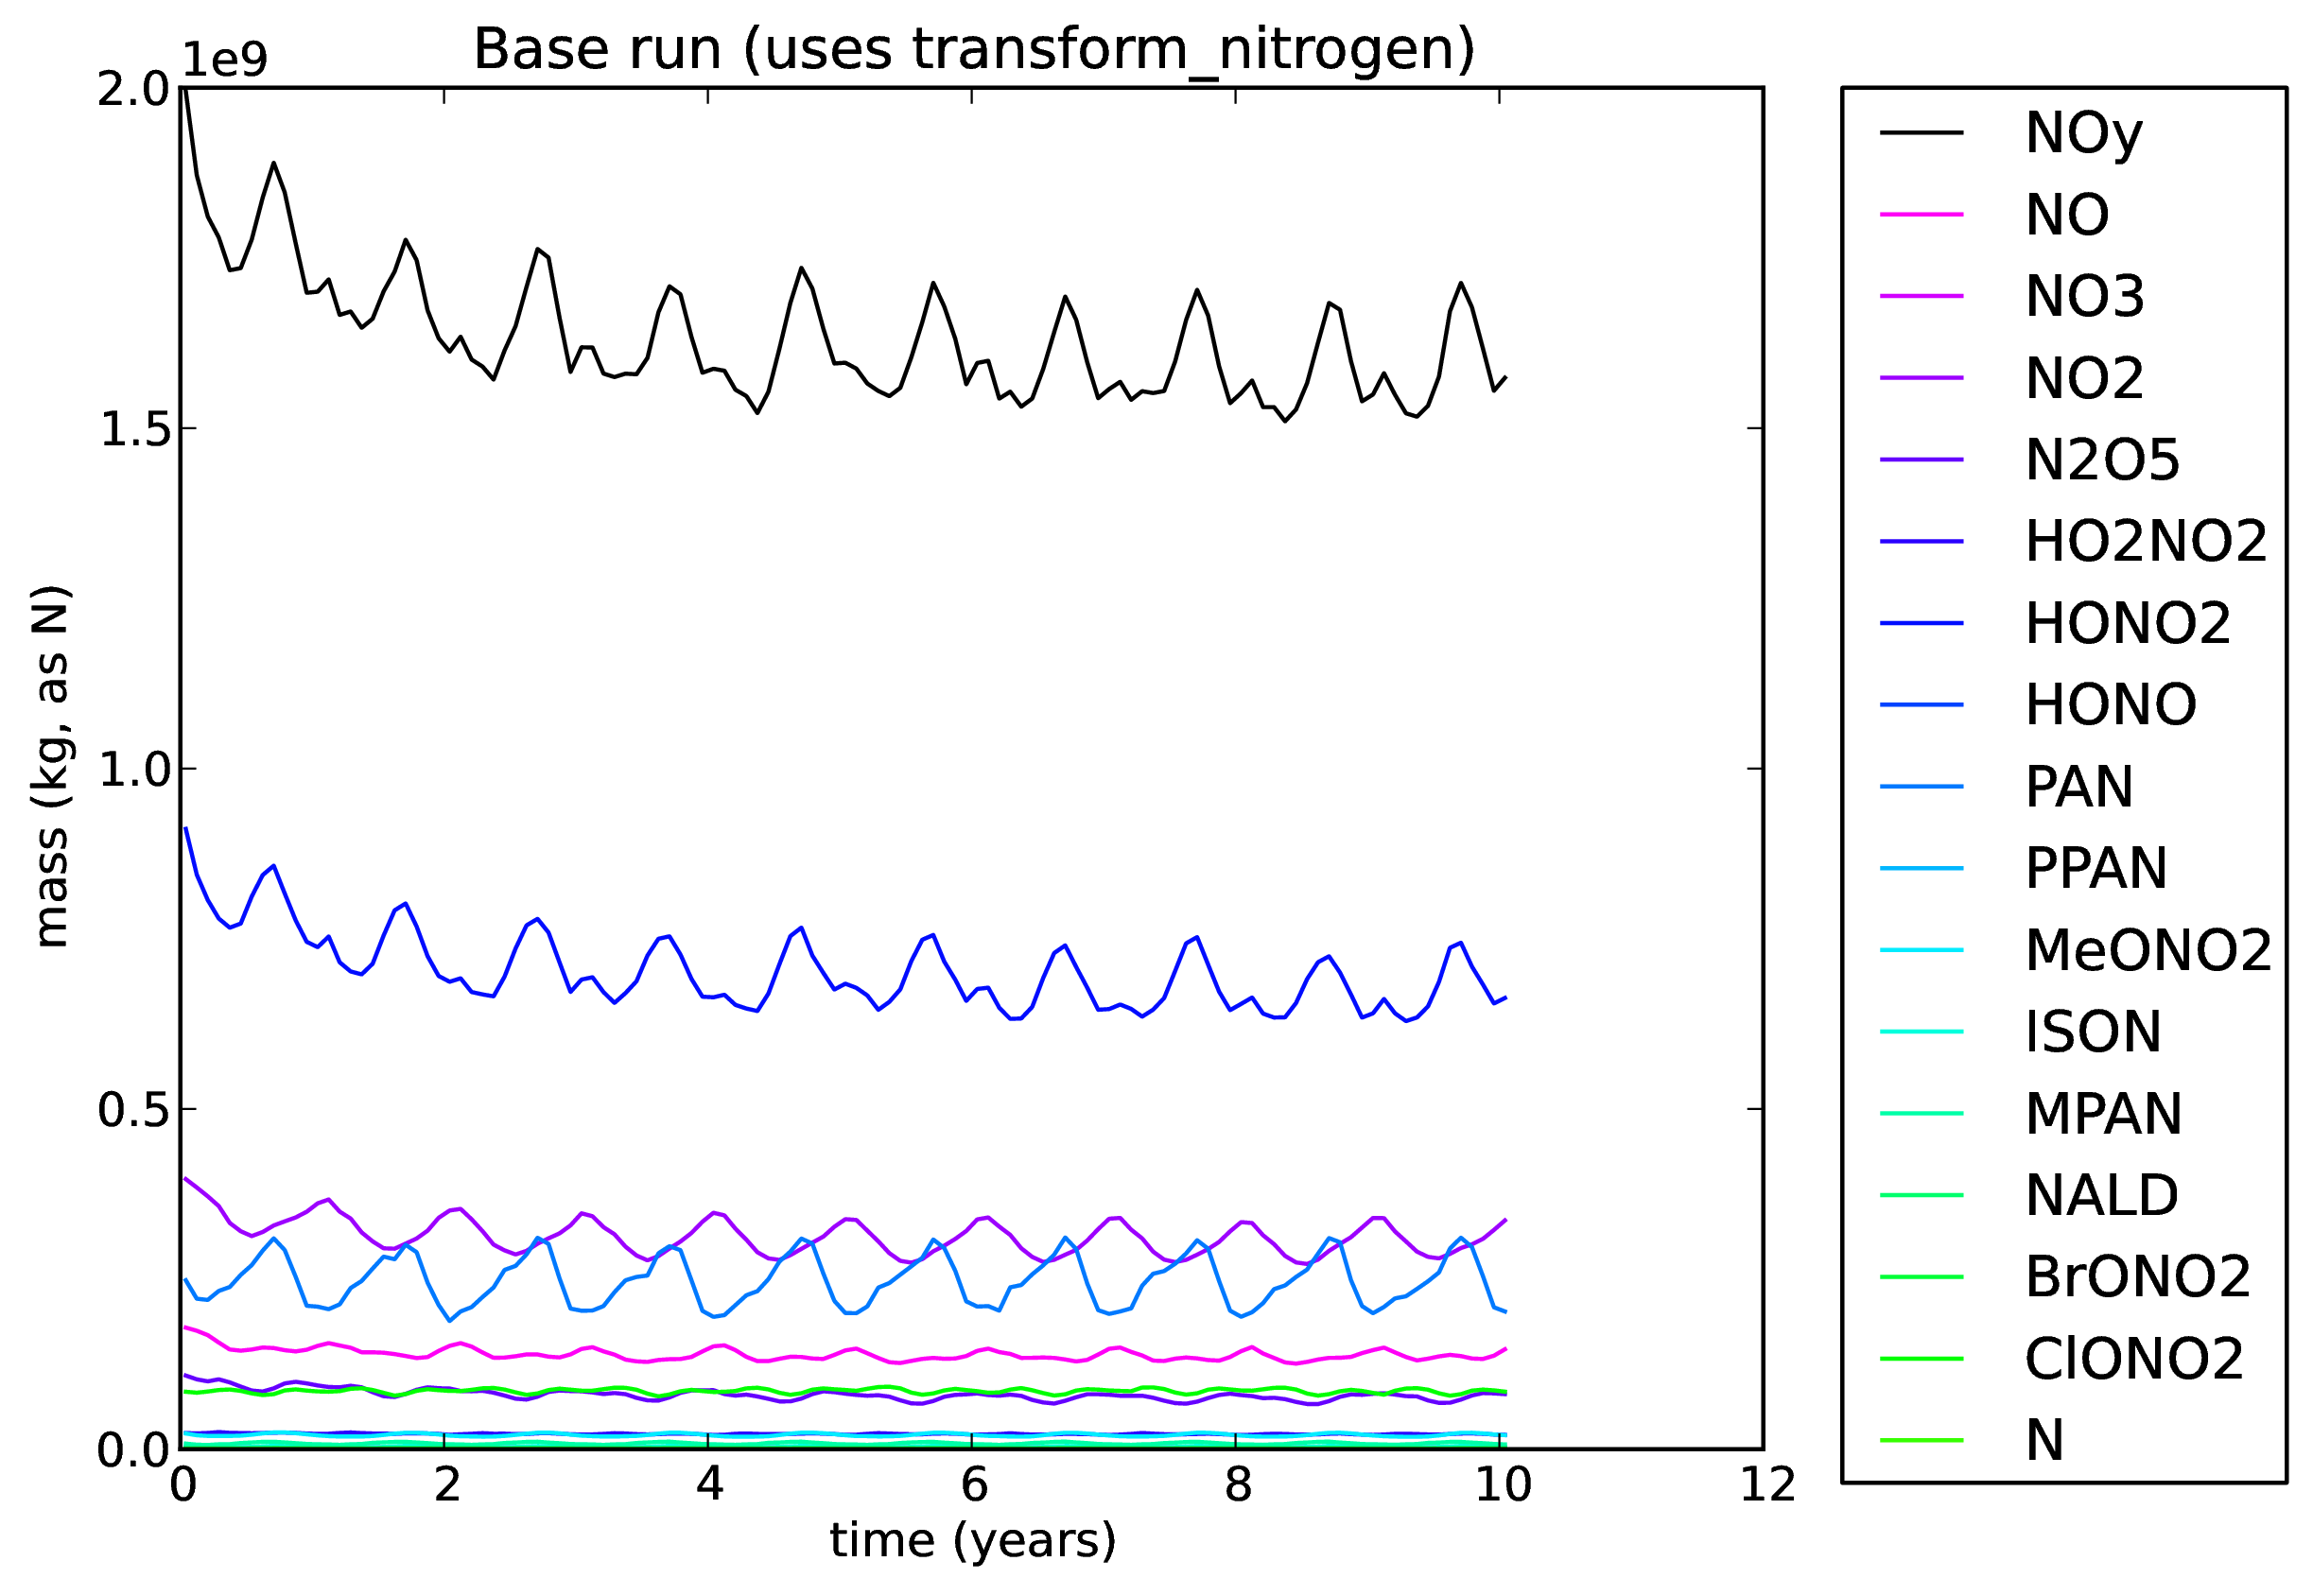
The NOy components of transform_halogen were removed, and implemented in a separate routine. Now, NO2 and lumped NOy are also advected and instead of NO2 being the residual instead a calculated_NOy field is computed from the separately advected NOy species, and this is compared to the transported_NOy field. The differences here are then used to tweak the NOy species that all allowed to be changed by the routine (currently, not ClONO2 and BrONO2). This is job xjcis.
The image below shows the evolution of the total atmospheric mass of each of the NOy species, in kg(species). Note that NOy is given in kg(N).
The model is still spinning up slightly from the initial condition.
All plots from this run can be found here: ![]() Base_xjcis.pdf
Base_xjcis.pdf ![]()
2. Doubled HNO3
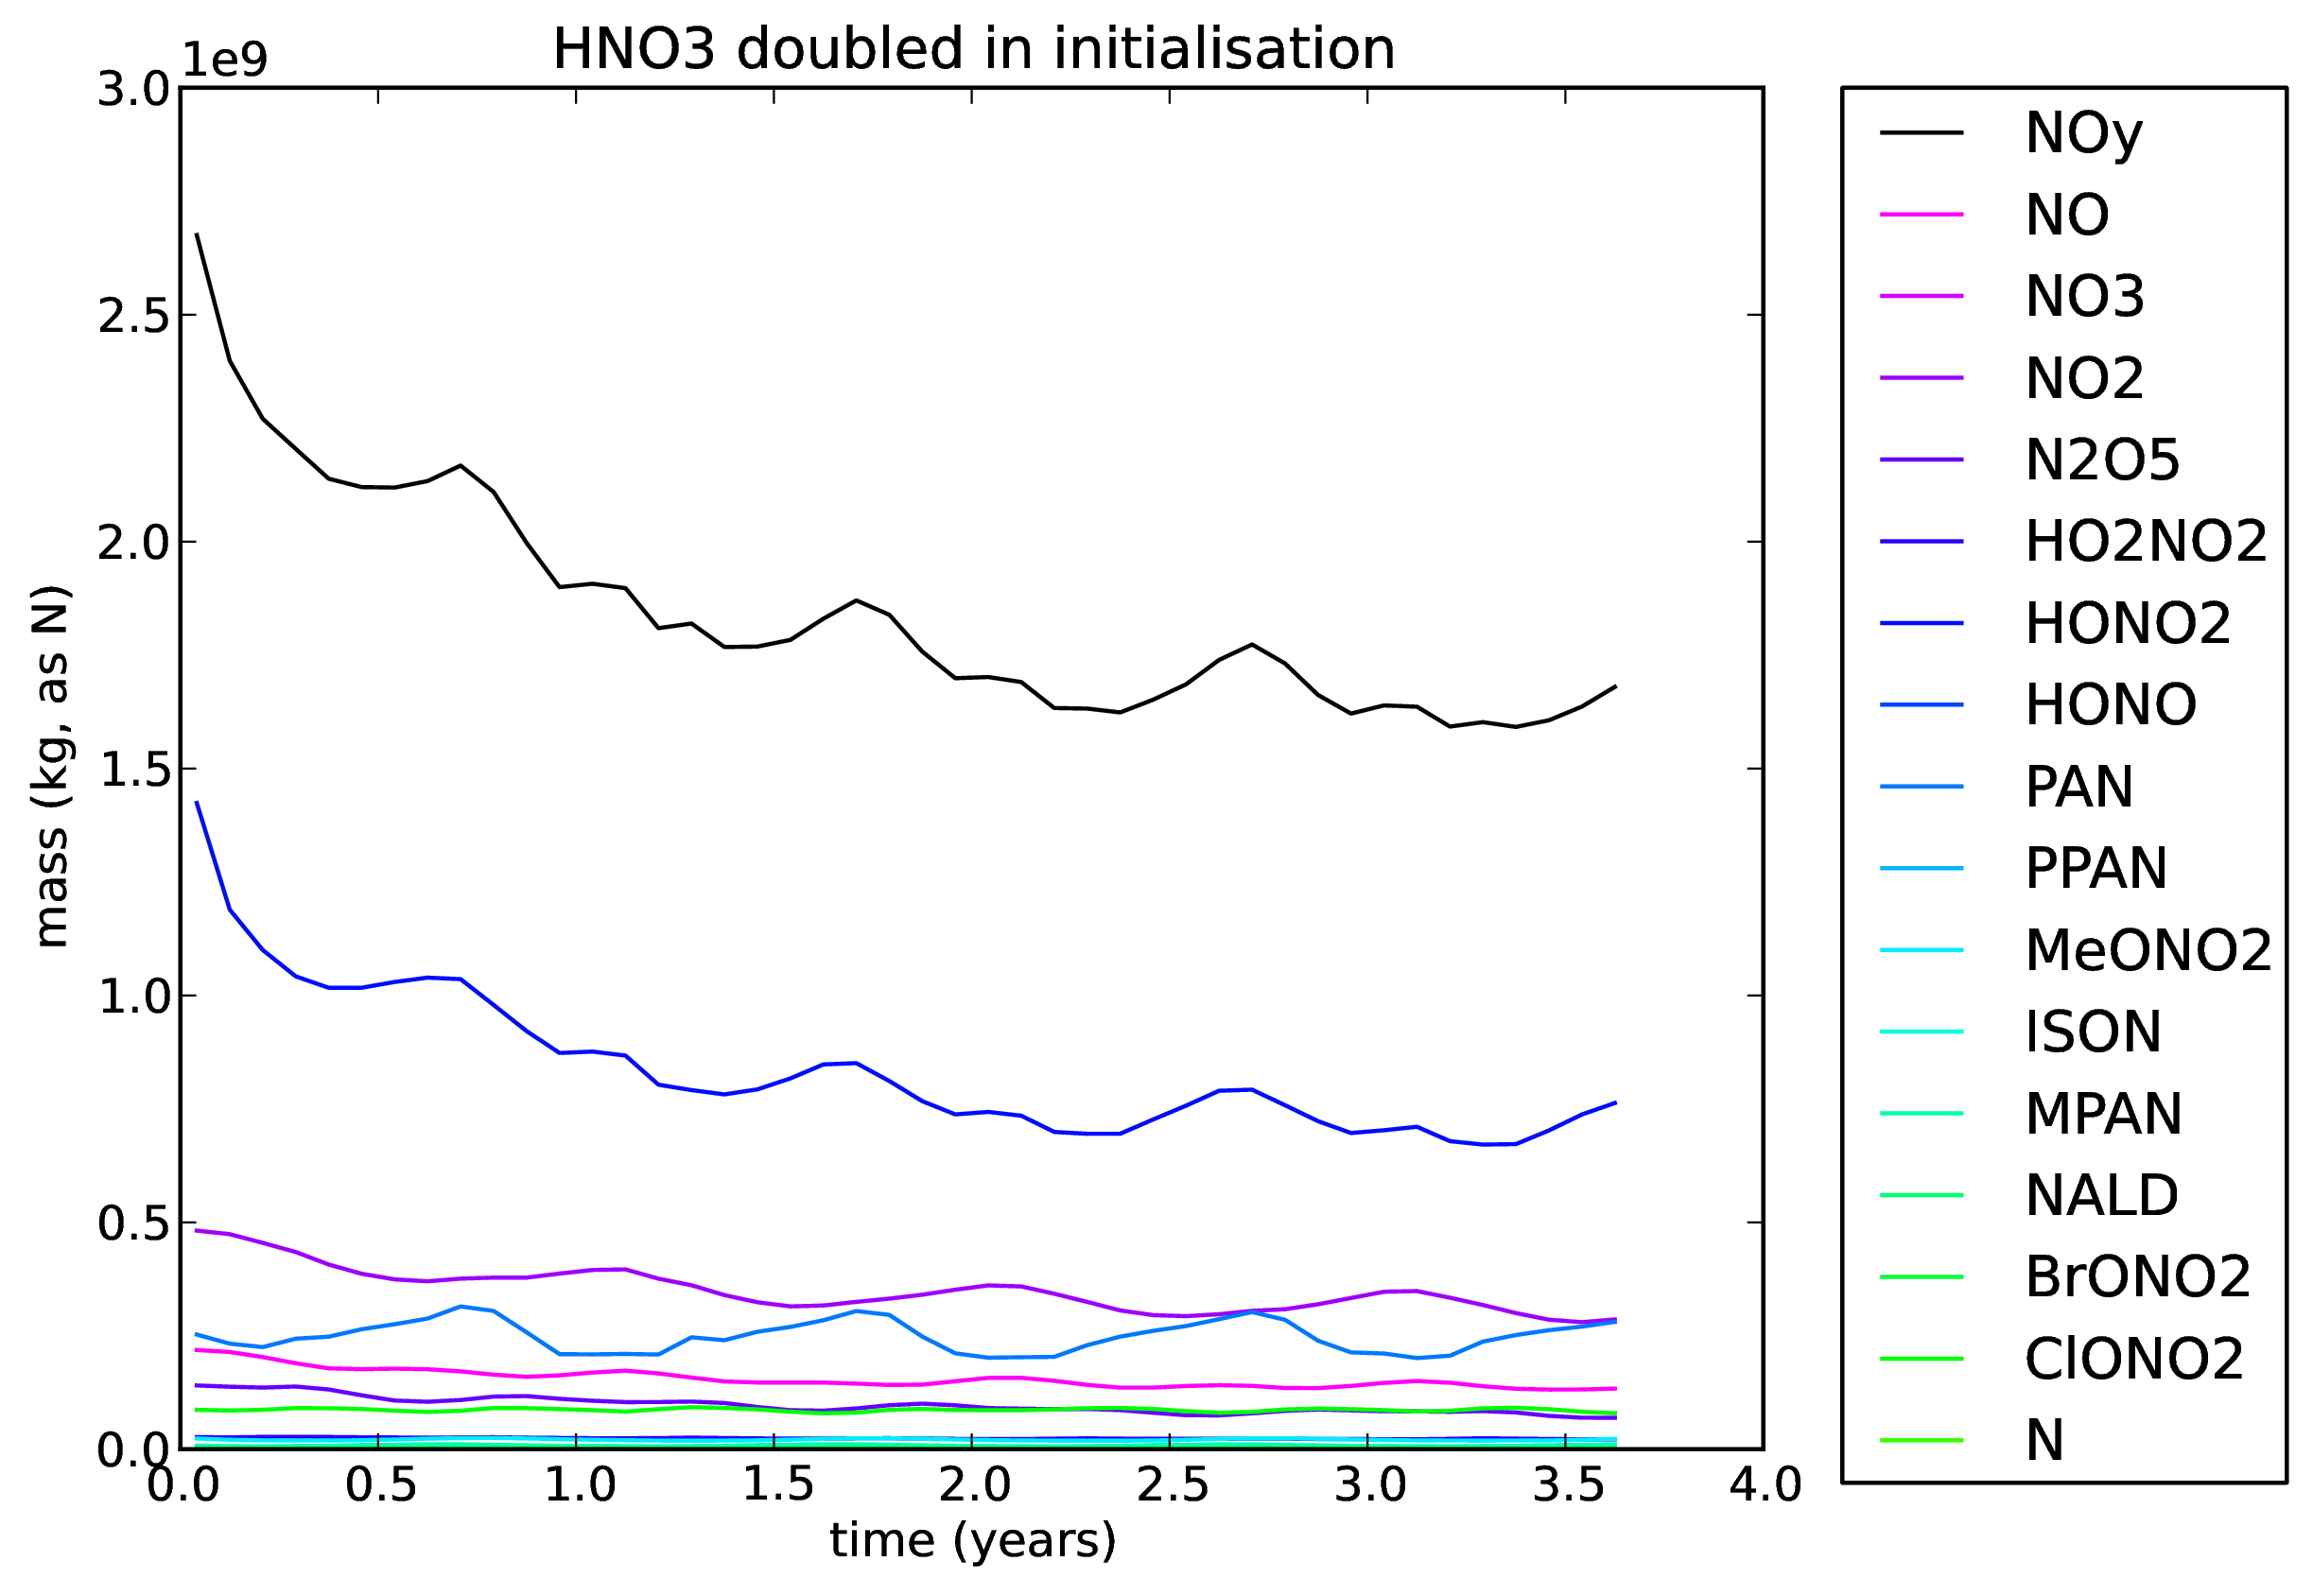
A copy of xjcis (and so transform_nitrogen was still used) was taken and the HNO3 initial condition was doubled (contribution also included in NOy) to bring the values up to what should be expected. This is job xjcit.
The image below shows the evolution of the total atmospheric mass of each of the NOy species, in kg(species). Note that NOy is given in kg(N), and the shorter x-axis.
The run was stop after only a few years as the HNO3 mass dropped rather quickly. The NOy mass also drops.
All plots from this run can be found here: ![]() HNO3x2_xjcit.pdf
HNO3x2_xjcit.pdf ![]()
3. No production or loss of any NOy species
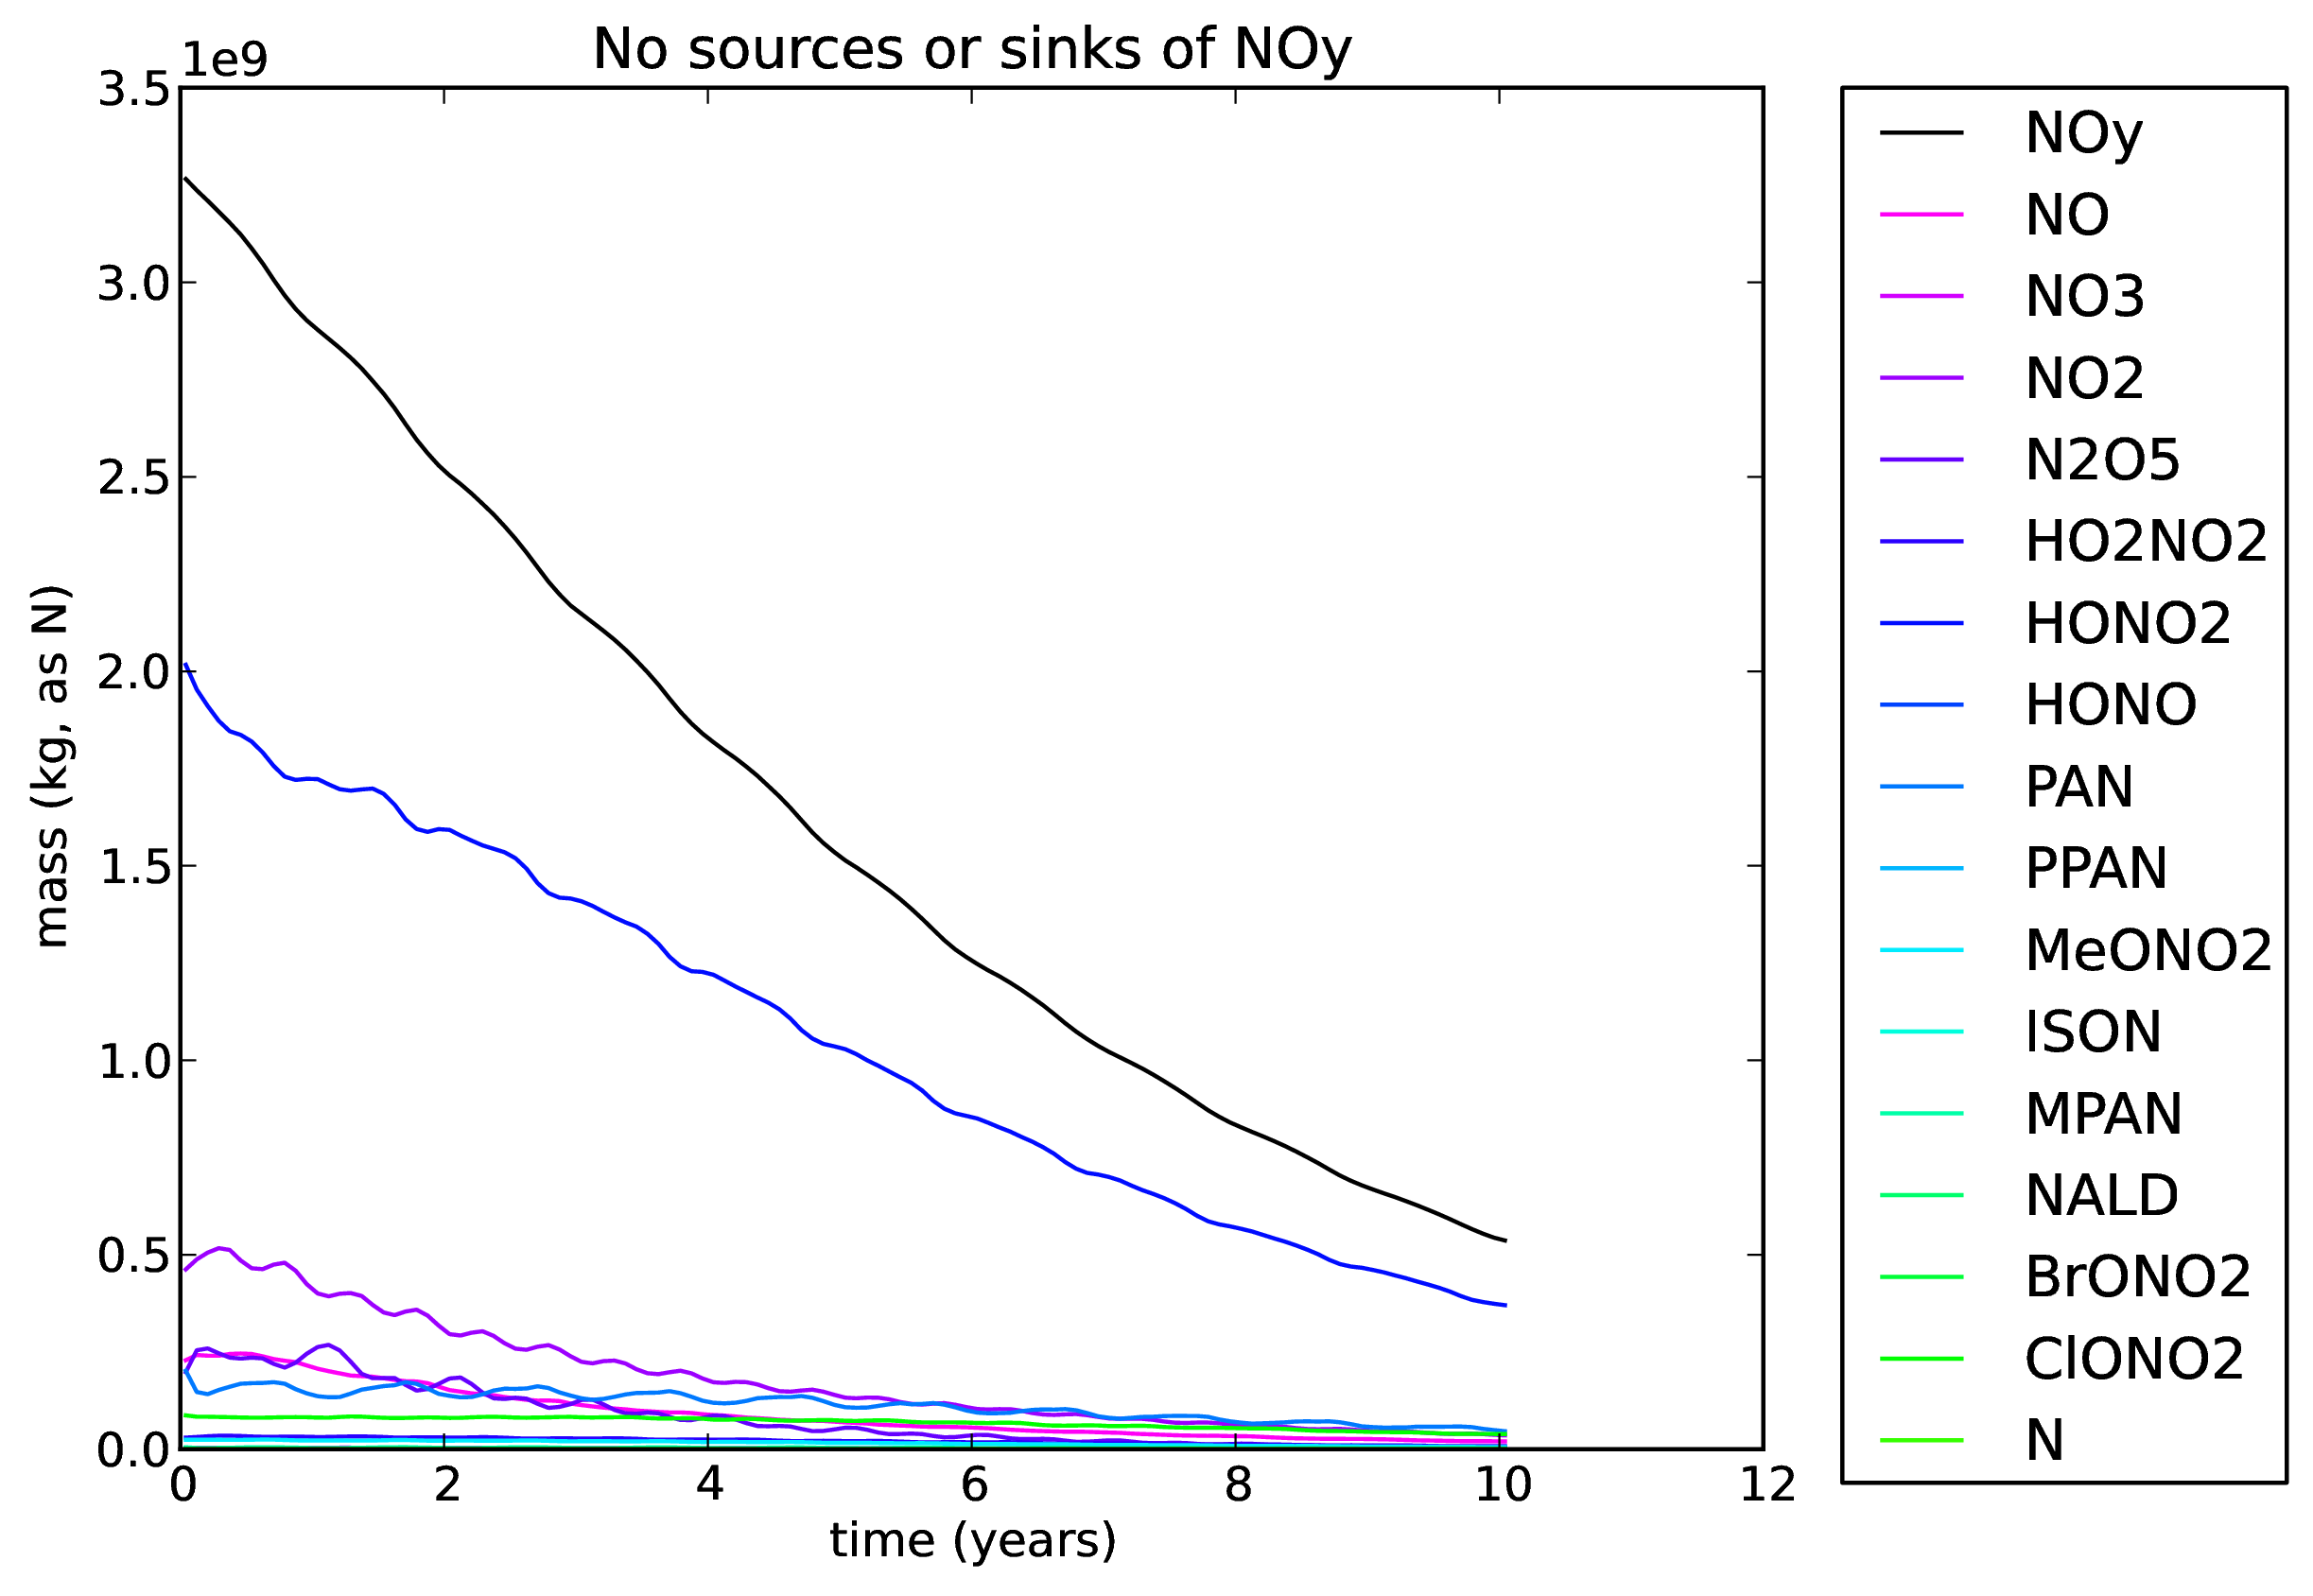
A copy of xjcit was taken (i.e. including the doubled HNO3 initial condition and using tranform_nitrogen). All sources and sinks of any NOy species were removed, i.e. no deposition, emissions, or sedimentation. All reactions were still included if they interconverted between NOy species, but any reactions which produced or removed NOy were not included. This is job xjciv.
The image below shows the evolution of the total atmospheric mass of each of the NOy species, in kg(species). Note that NOy is given in kg(N).
There is some interesting structure in the evolution of several of the species. These can be highlighted if required. While a lot of the species seem to have an exponential decay, others do not.
All plots from this run can be found here: ![]() NoSourceSink_xjciv.pdf
NoSourceSink_xjciv.pdf ![]()
Alex has also done some additional analysis: ![]() Xjciv_NOy_chem.pdf
Xjciv_NOy_chem.pdf ![]()
4. No calls to any UKCA routines
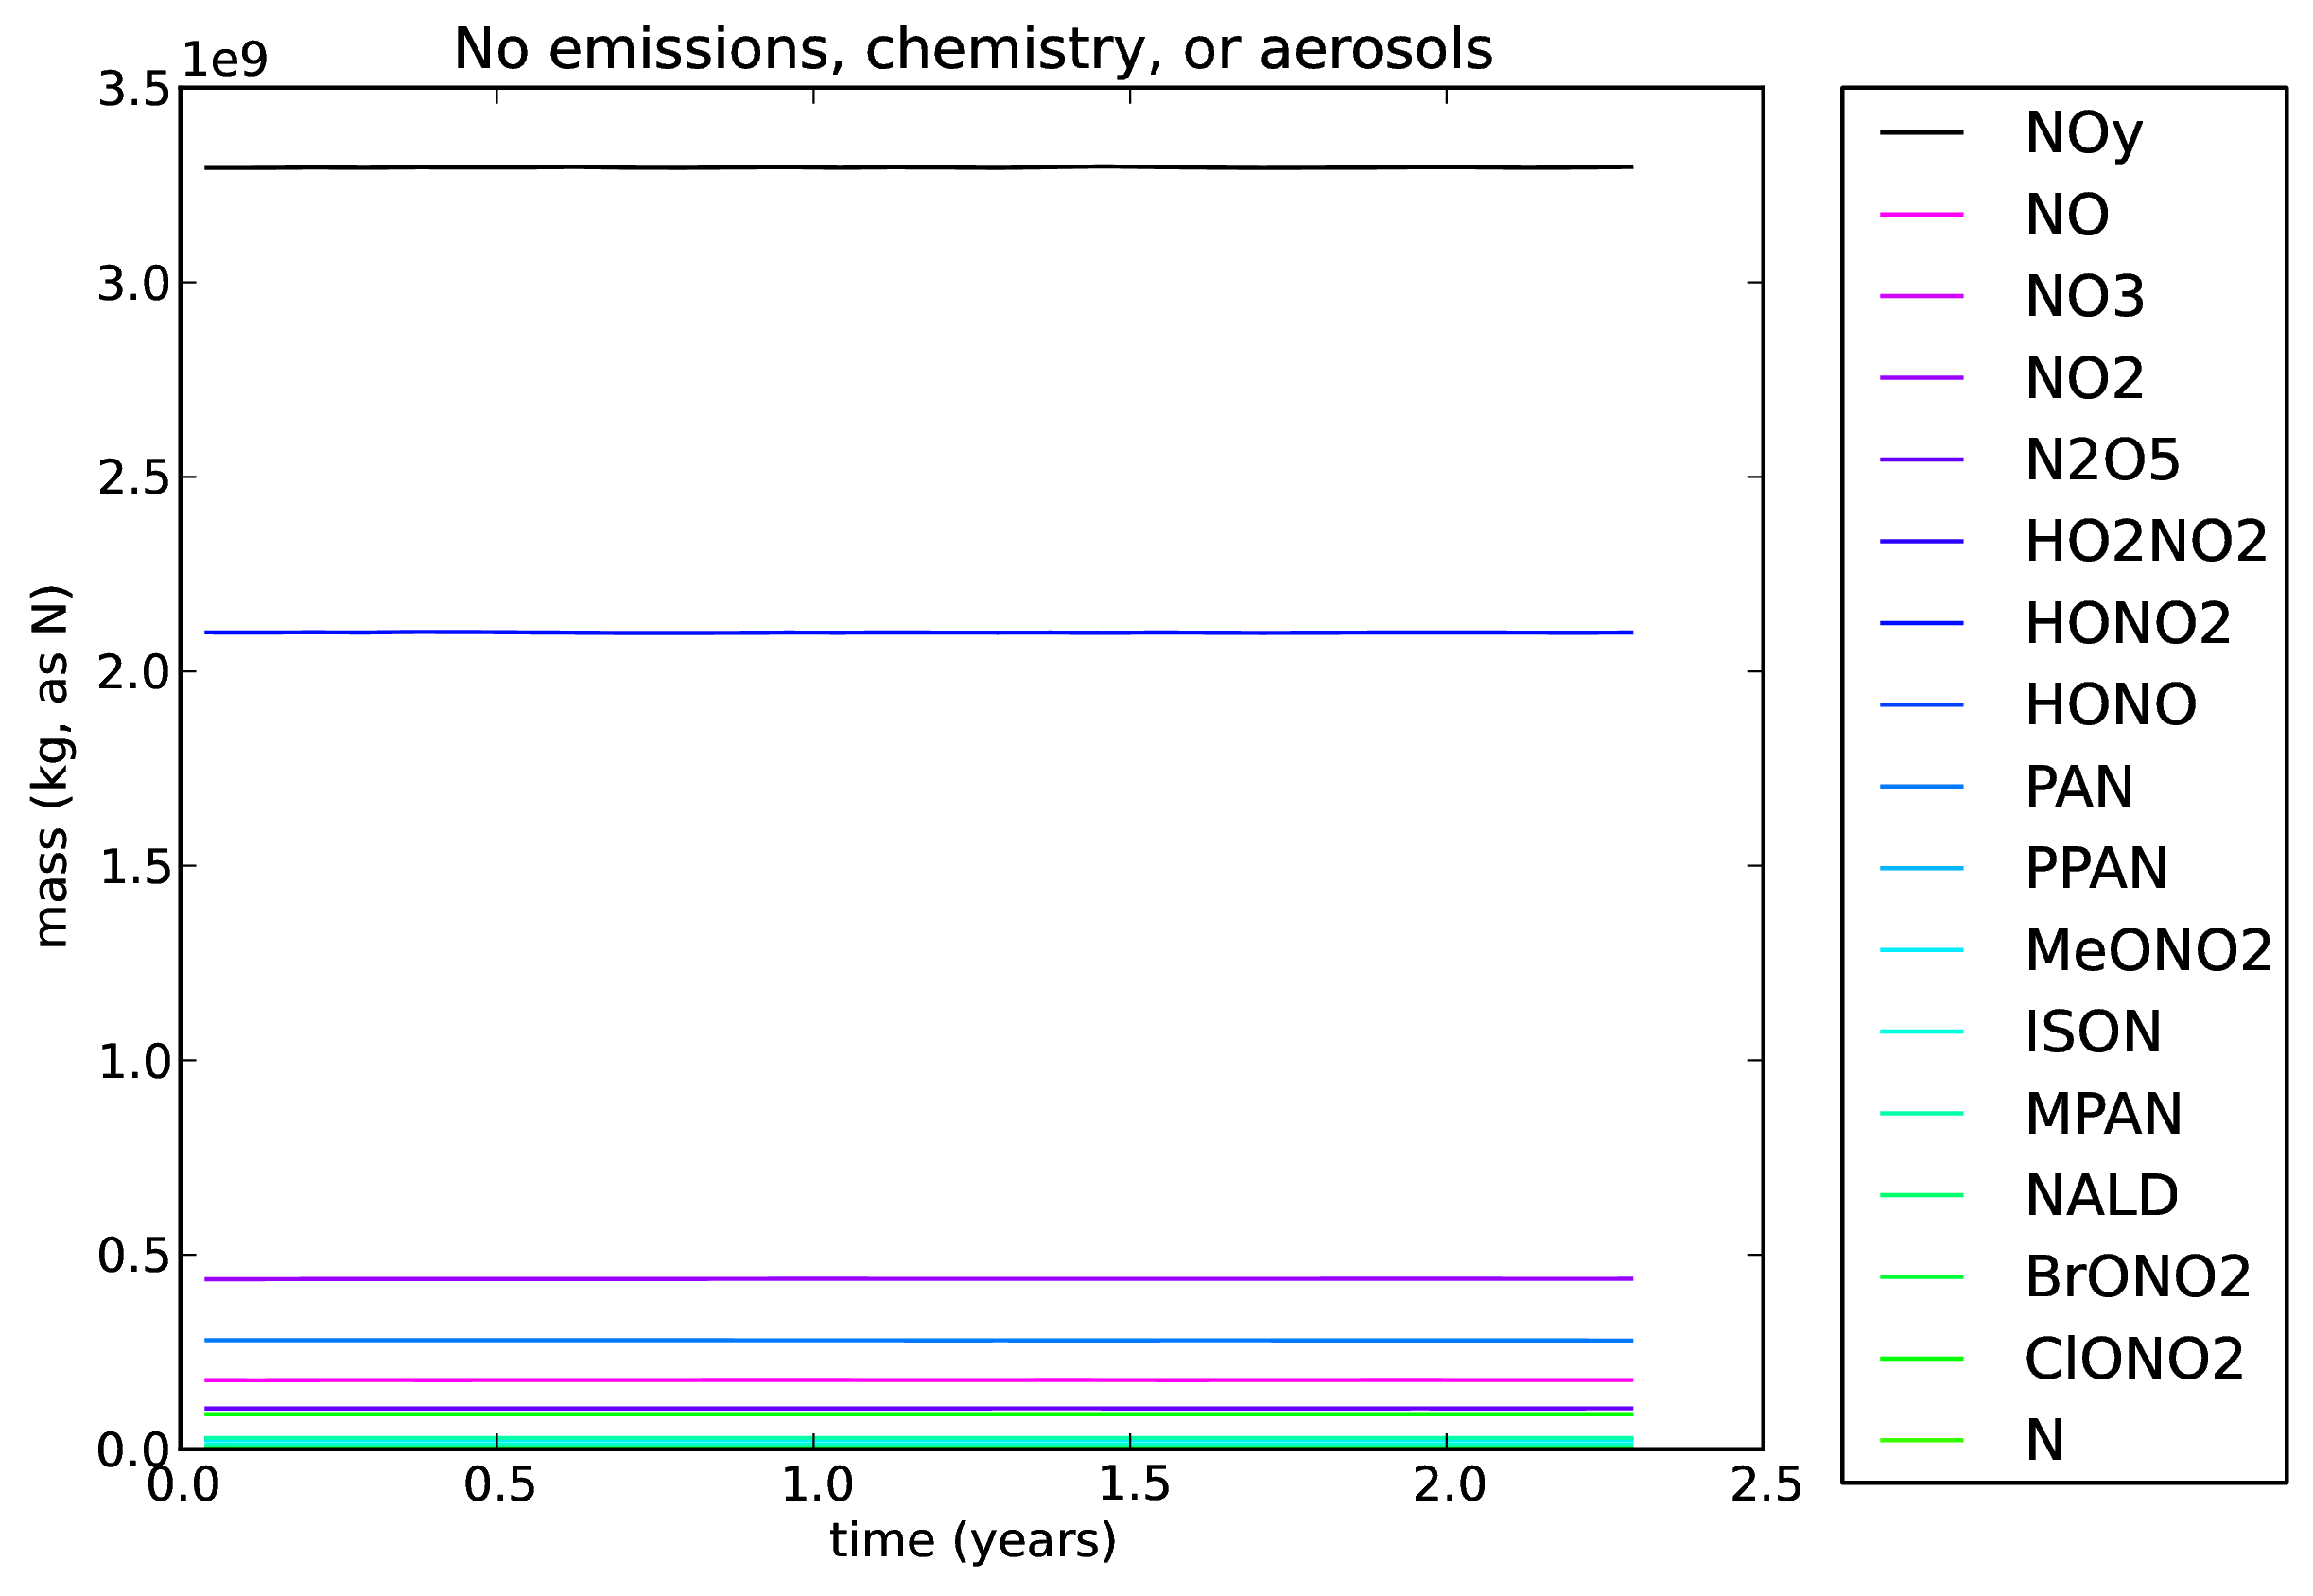
A copy of xjciv was taken (including the doubled HNO3 initial condition), and calls to the transform_halogen/nitrogen, fastjx, emission_ctl, chemistry_ctl, and aero_ctl routines were removed. This is job xkqhb.
The image below shows the evolution of the total atmospheric mass of each of the NOy species, in kg(species). Note that NOy is given in kg(N), and the shorter x-axis.
This is as expected. The tracer transport scheme should be globally mass conserving, and it is. If it were not we would have had a bigger problem! This test also confirms that the problem is contained within UKCA itself.
All plots from this run can be found here: ![]() NoEmsChemAero_xkqhb.pdf
NoEmsChemAero_xkqhb.pdf ![]()
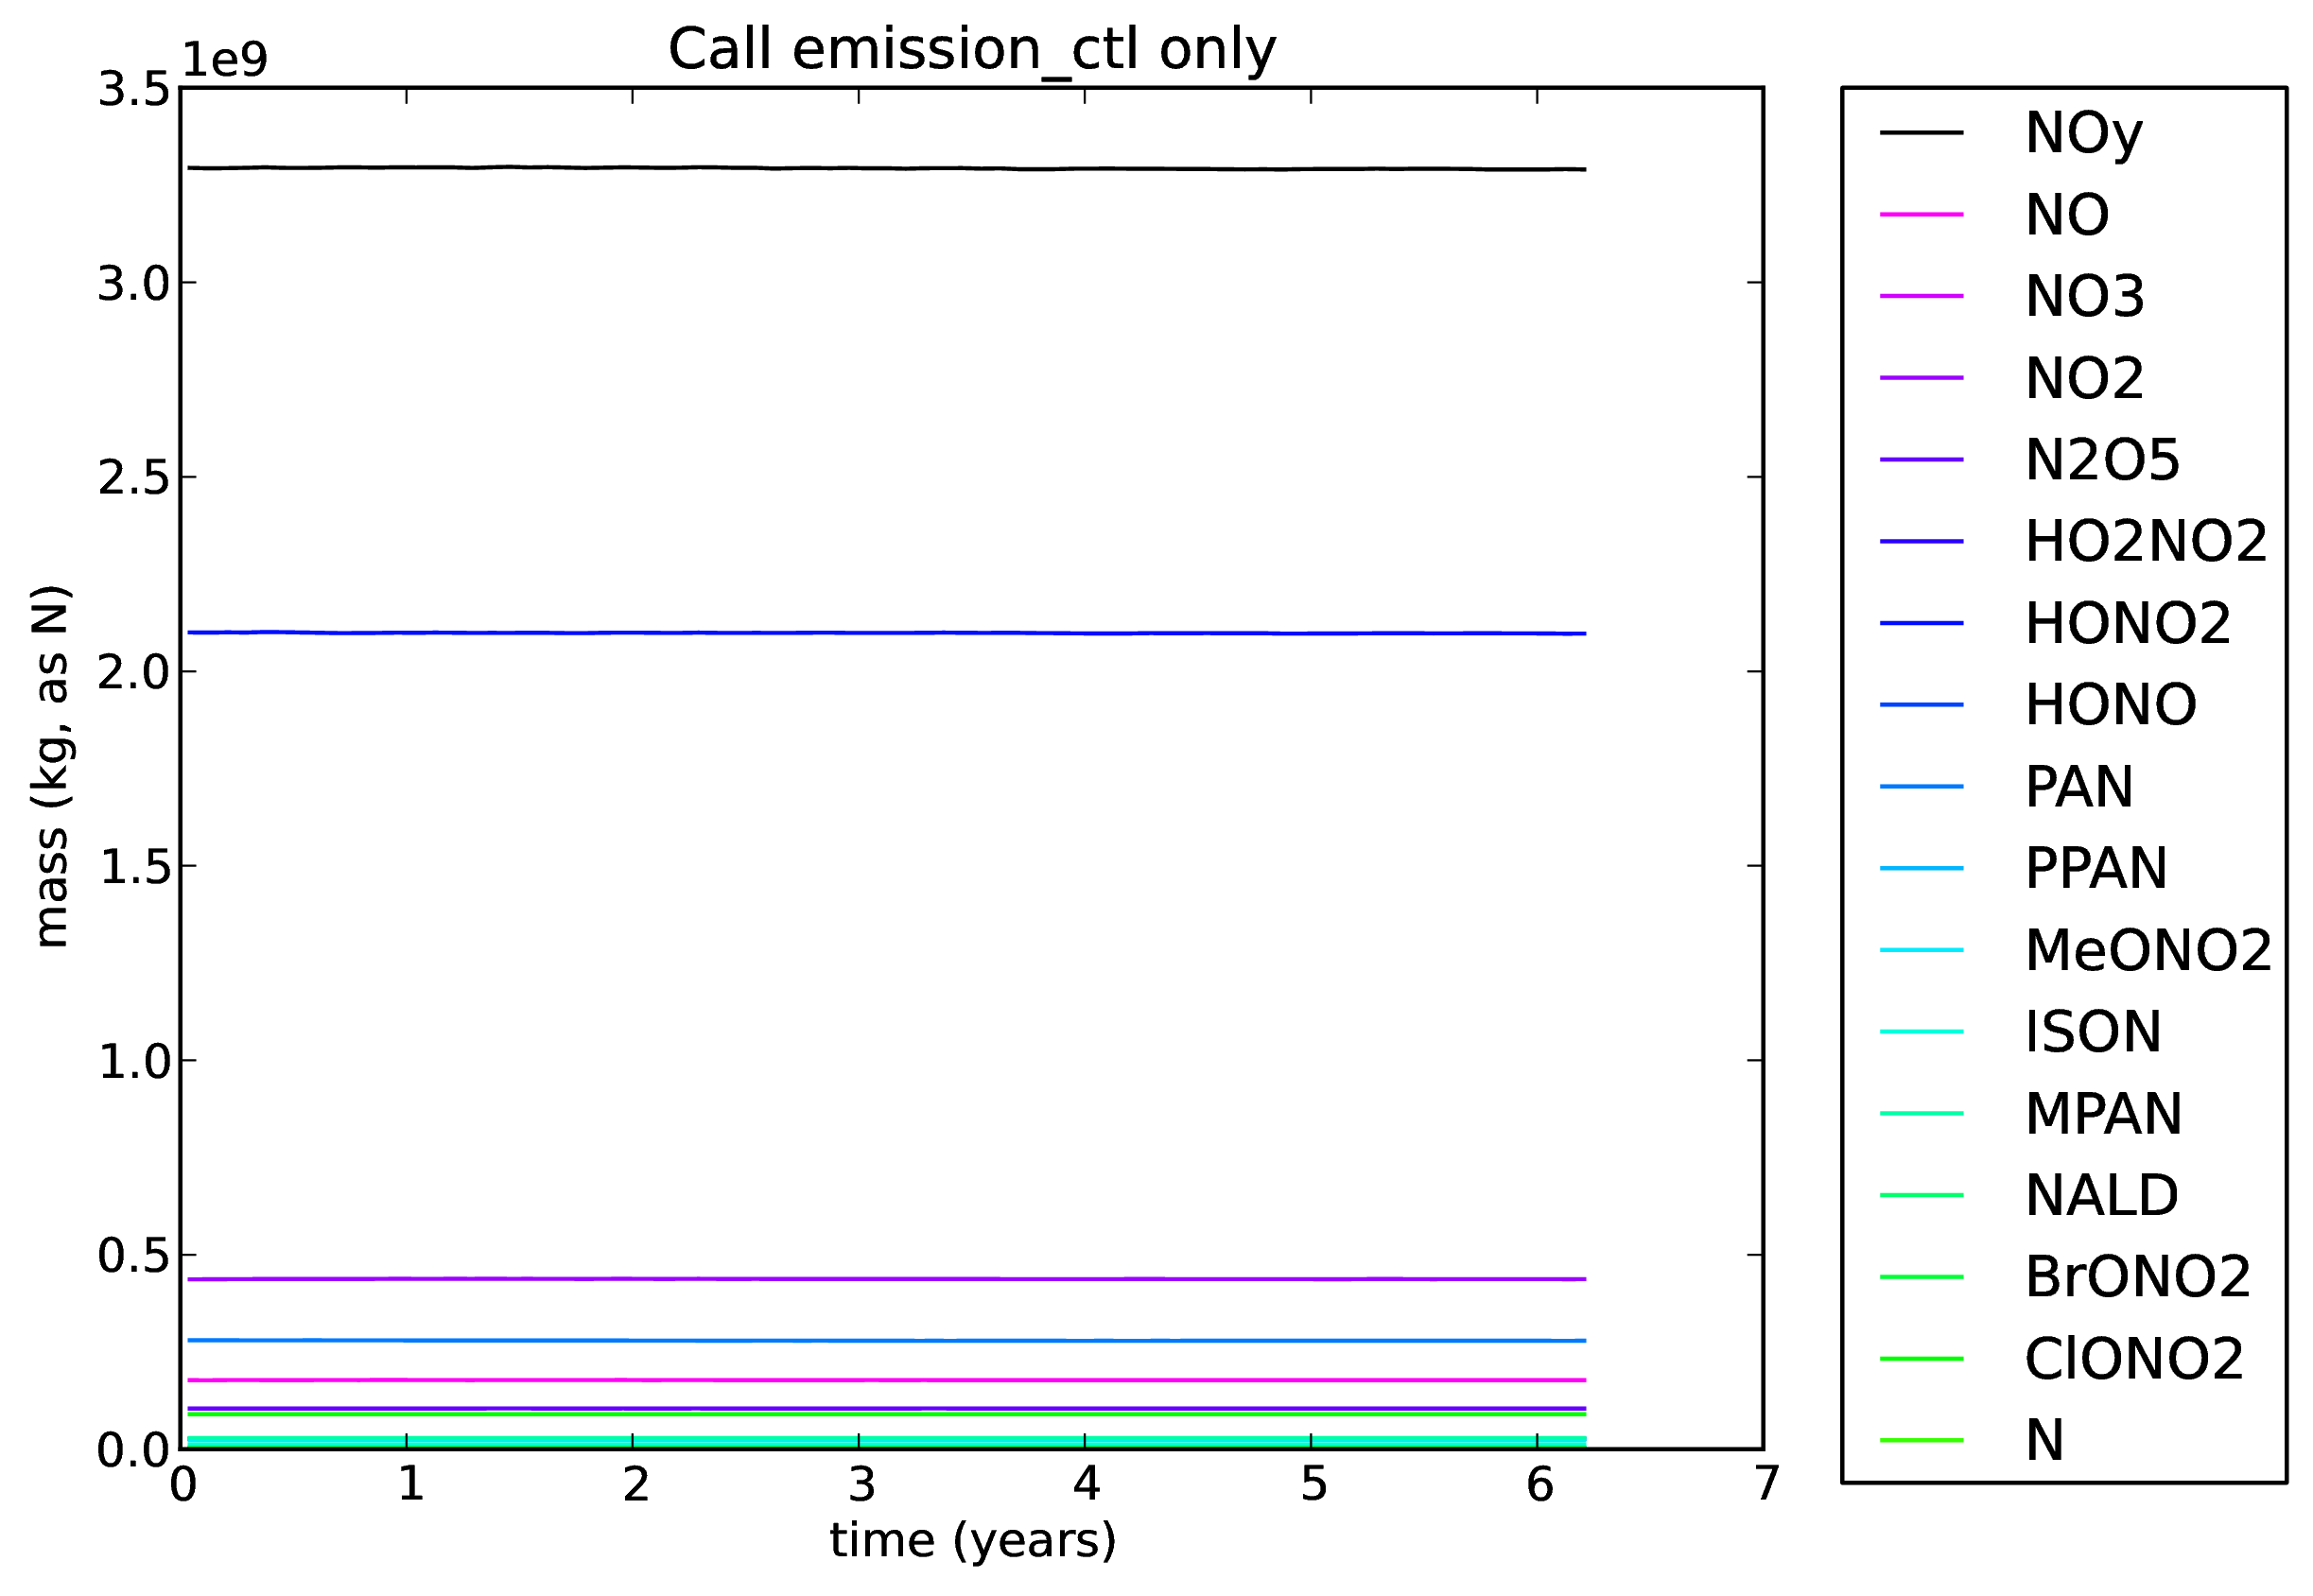
5. Call to ukca_emission_ctl only
A copy of xkqhb was taken (including the doubled HNO3 initial condition), and call to emission_ctl was included again (there were still no calls to the transform_halogen/nitrogen, fastjx, chemistry_ctl, and aero_ctl). Note that there were no emissions into any of the NOy species in this run. This is job xkqhc.
The image below shows the evolution of the total atmospheric mass of each of the NOy species, in kg(species). Note that NOy is given in kg(N), and the shorter x-axis.
As well as showing that the emission_ctl routine isn't causing the problem, this also shows that it isn't coming from boundary layer mixing, either, as this is done in emission_ctl for the section 34 (UKCA) tracers.
All plots from this run can be found here: ![]() EmsOnly_xkqhc.pdf
EmsOnly_xkqhc.pdf ![]()
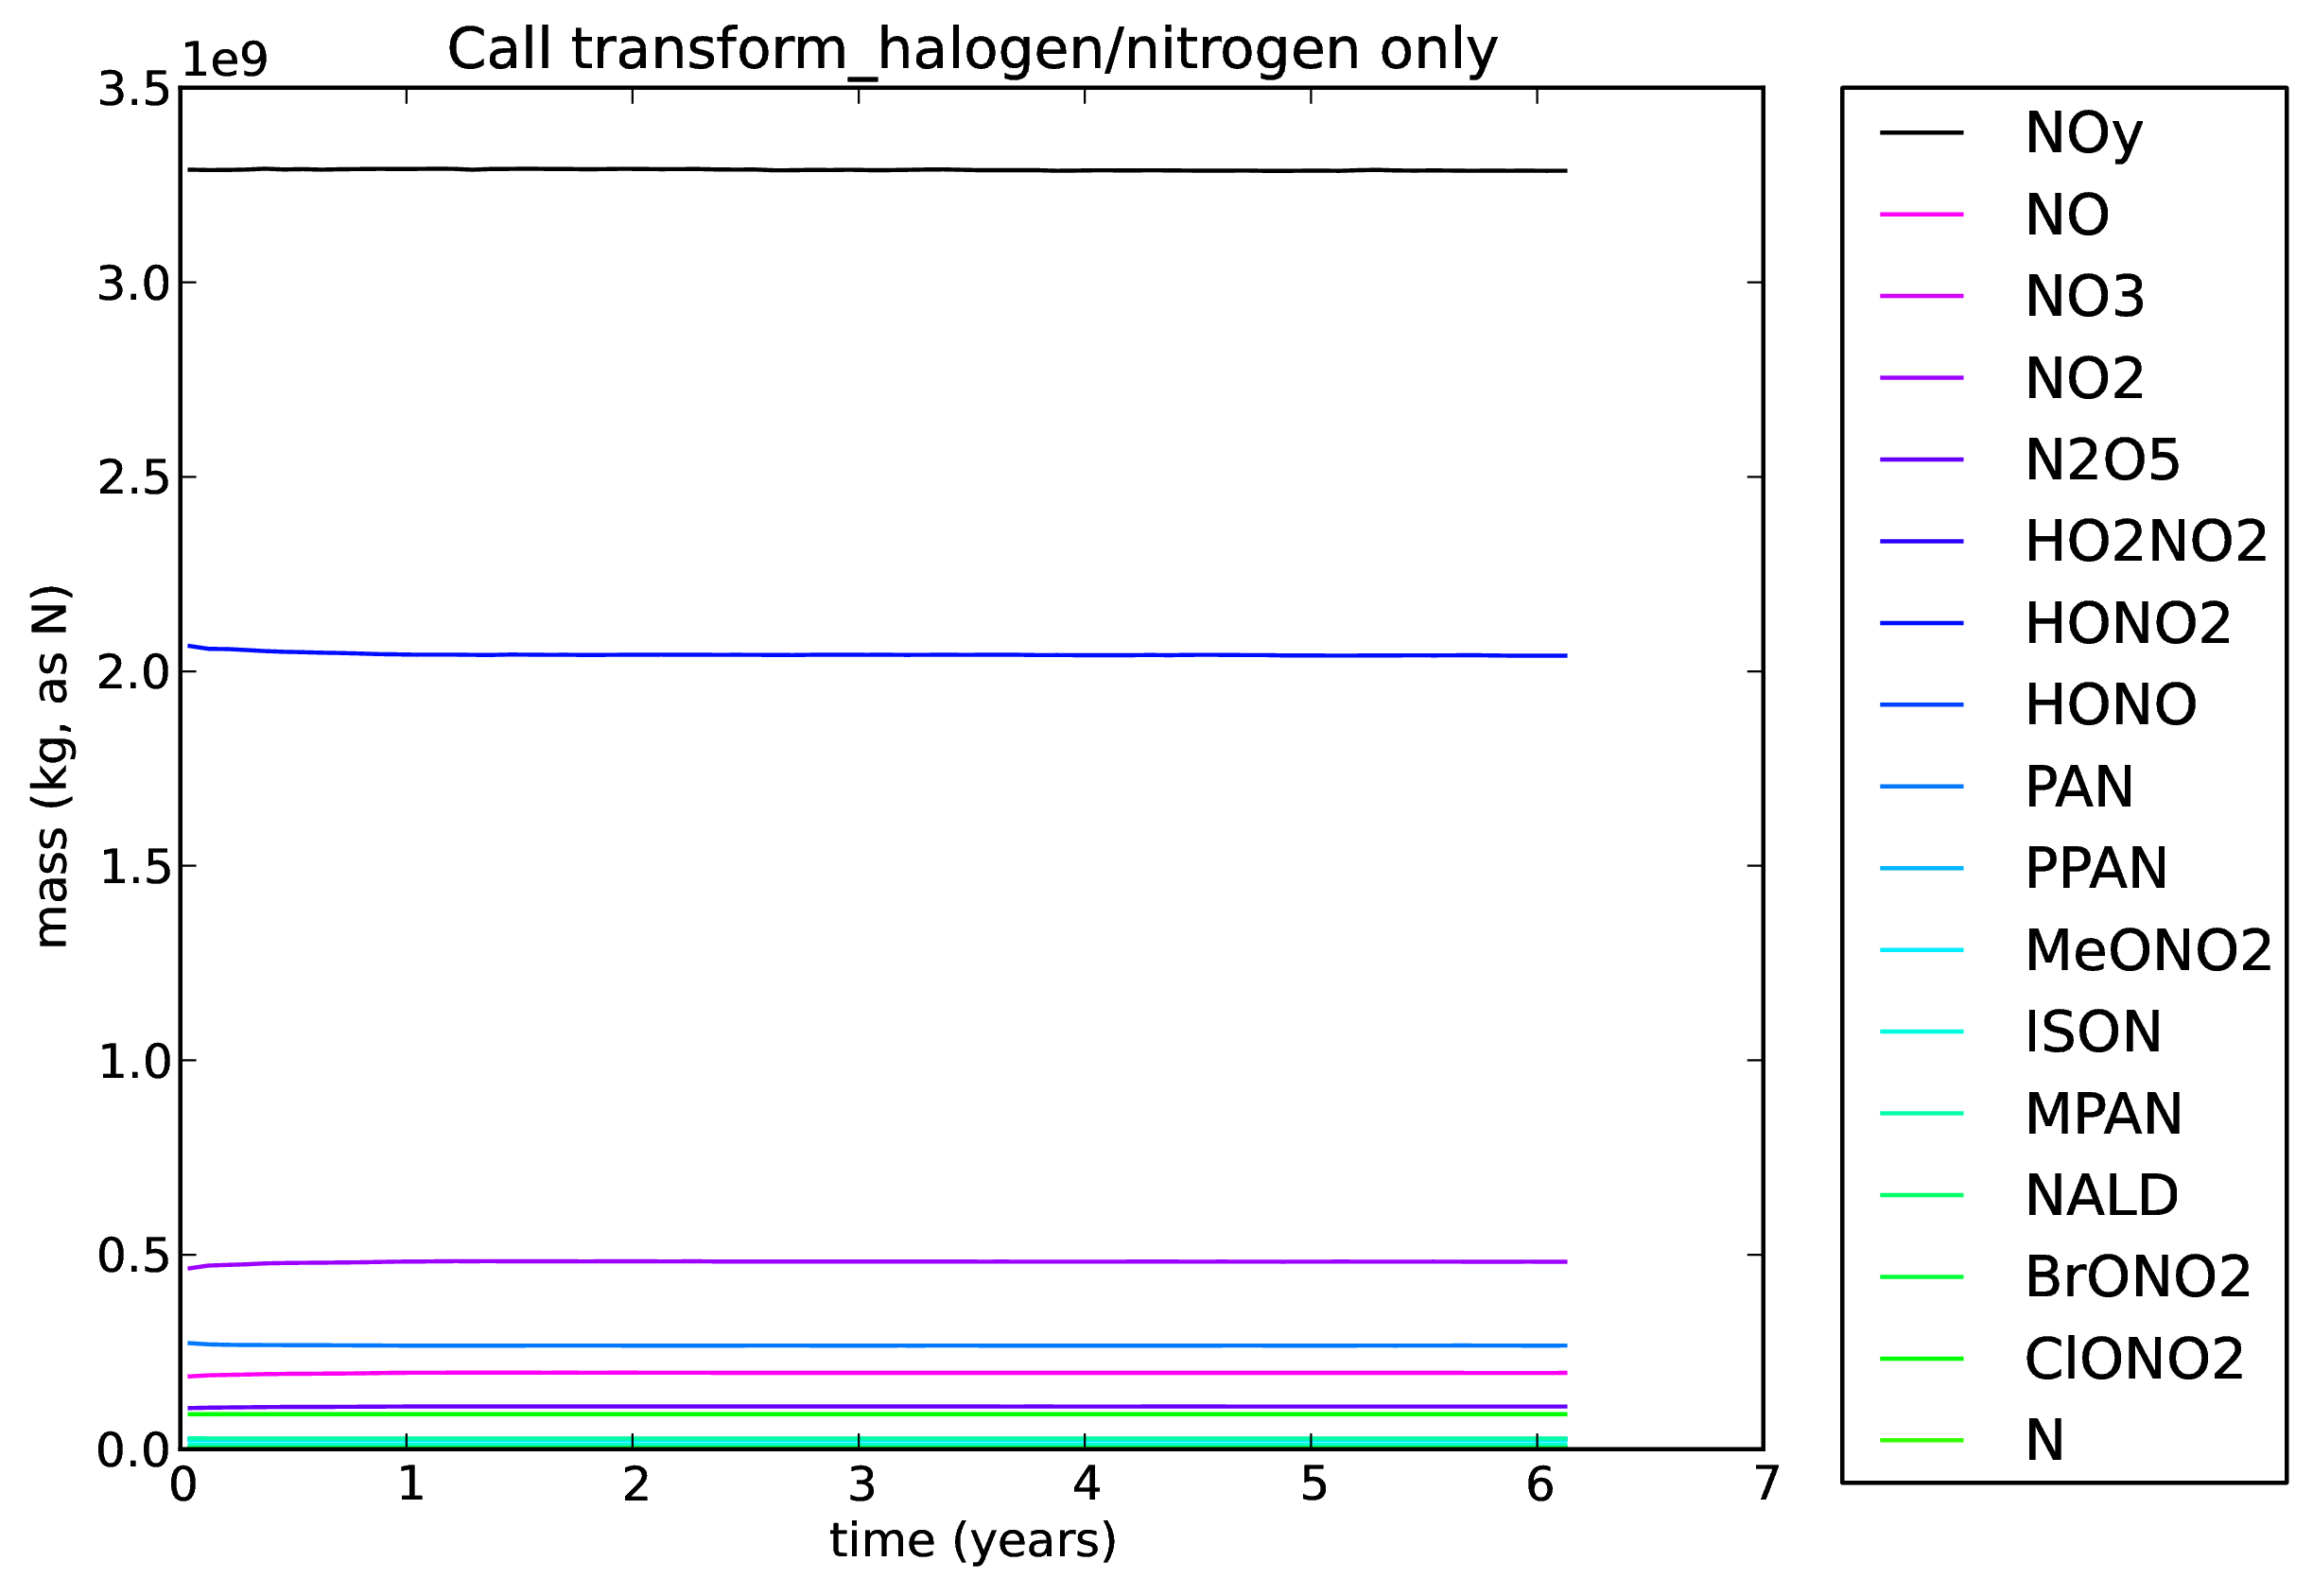
6. Call to transform_halogen and transform_nitrogen only
A copy of xkqhb was taken (including the doubled HNO3 initial condition), and the forward and backward calls to transform_halogen and transform_nitrogen were included again (there were still no calls to the emission_ctl fastjx, chemistry_ctl, and aero_ctl). This is job xkqhd.
The image below shows the evolution of the total atmospheric mass of each of the NOy species, in kg(species). Note that NOy is given in kg(N), and the shorter x-axis.
There are some corrections to the NOy species initially (these probably go down as the horizontal gradients are smoothed out during the run). However, NOy remains mostly constant and does not drop by very much.
All plots from this run can be found here: ![]() TransOnly_xkqhd.pdf
TransOnly_xkqhd.pdf ![]()
7. Call to transform_halogen, transform_nitrogen, and chemistry_ctl only
A copy of xkqhd was taken (including the doubled HNO3 initial condition), and, as well as the forward and backward calls to transform_halogen and transform_nitrogen, the call to chemistry_ctl was included again (there were still no calls to the emission_ctl fastjx, and aero_ctl). While FastJX was not used (the rates from this routine were set to zero), there is still a contribution to the photolysis rates from the lookup table scheme in the upper levels of the model. This is job xkqhe.
The image below shows the evolution of the total atmospheric mass of each of the NOy species, in kg(species). Note that NOy is given in kg(N), and the shorter x-axis.
There should be changes to the NOy species, which may involve them increasing or decreasing during the course of the run.
All plots from this run can be found here: ![]() TransChemOnly_xkqhe.pdf
TransChemOnly_xkqhe.pdf ![]()
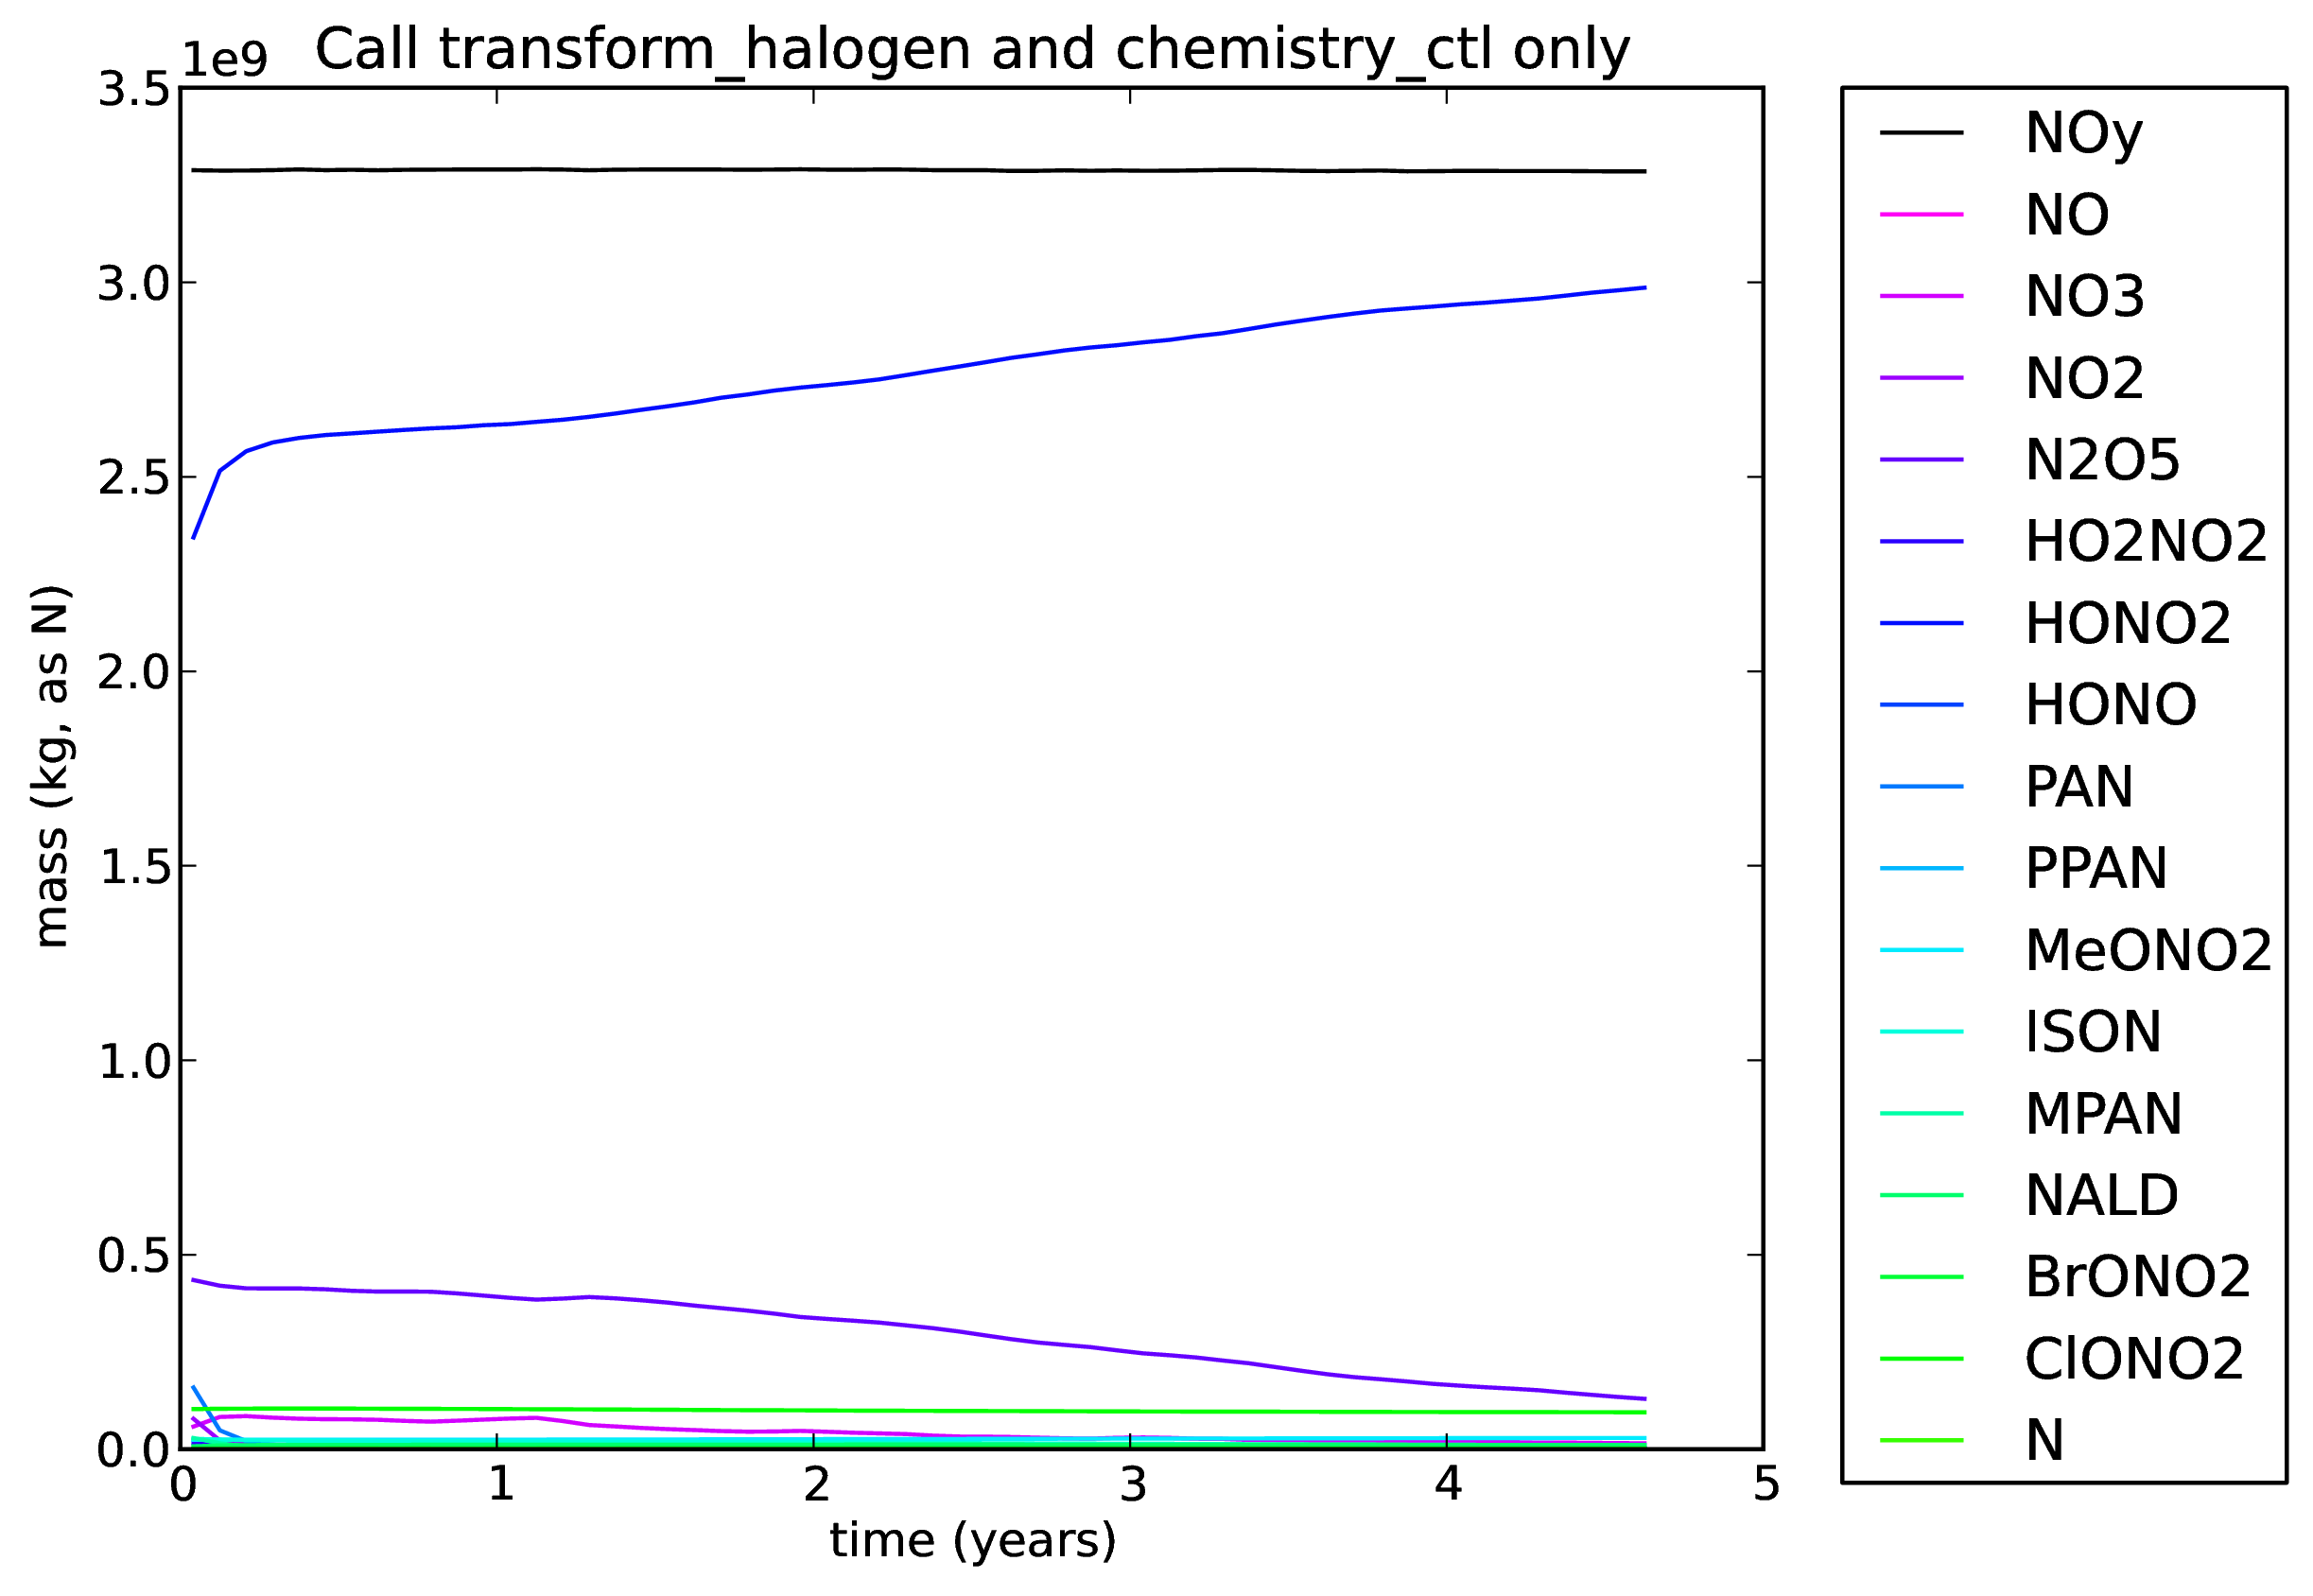
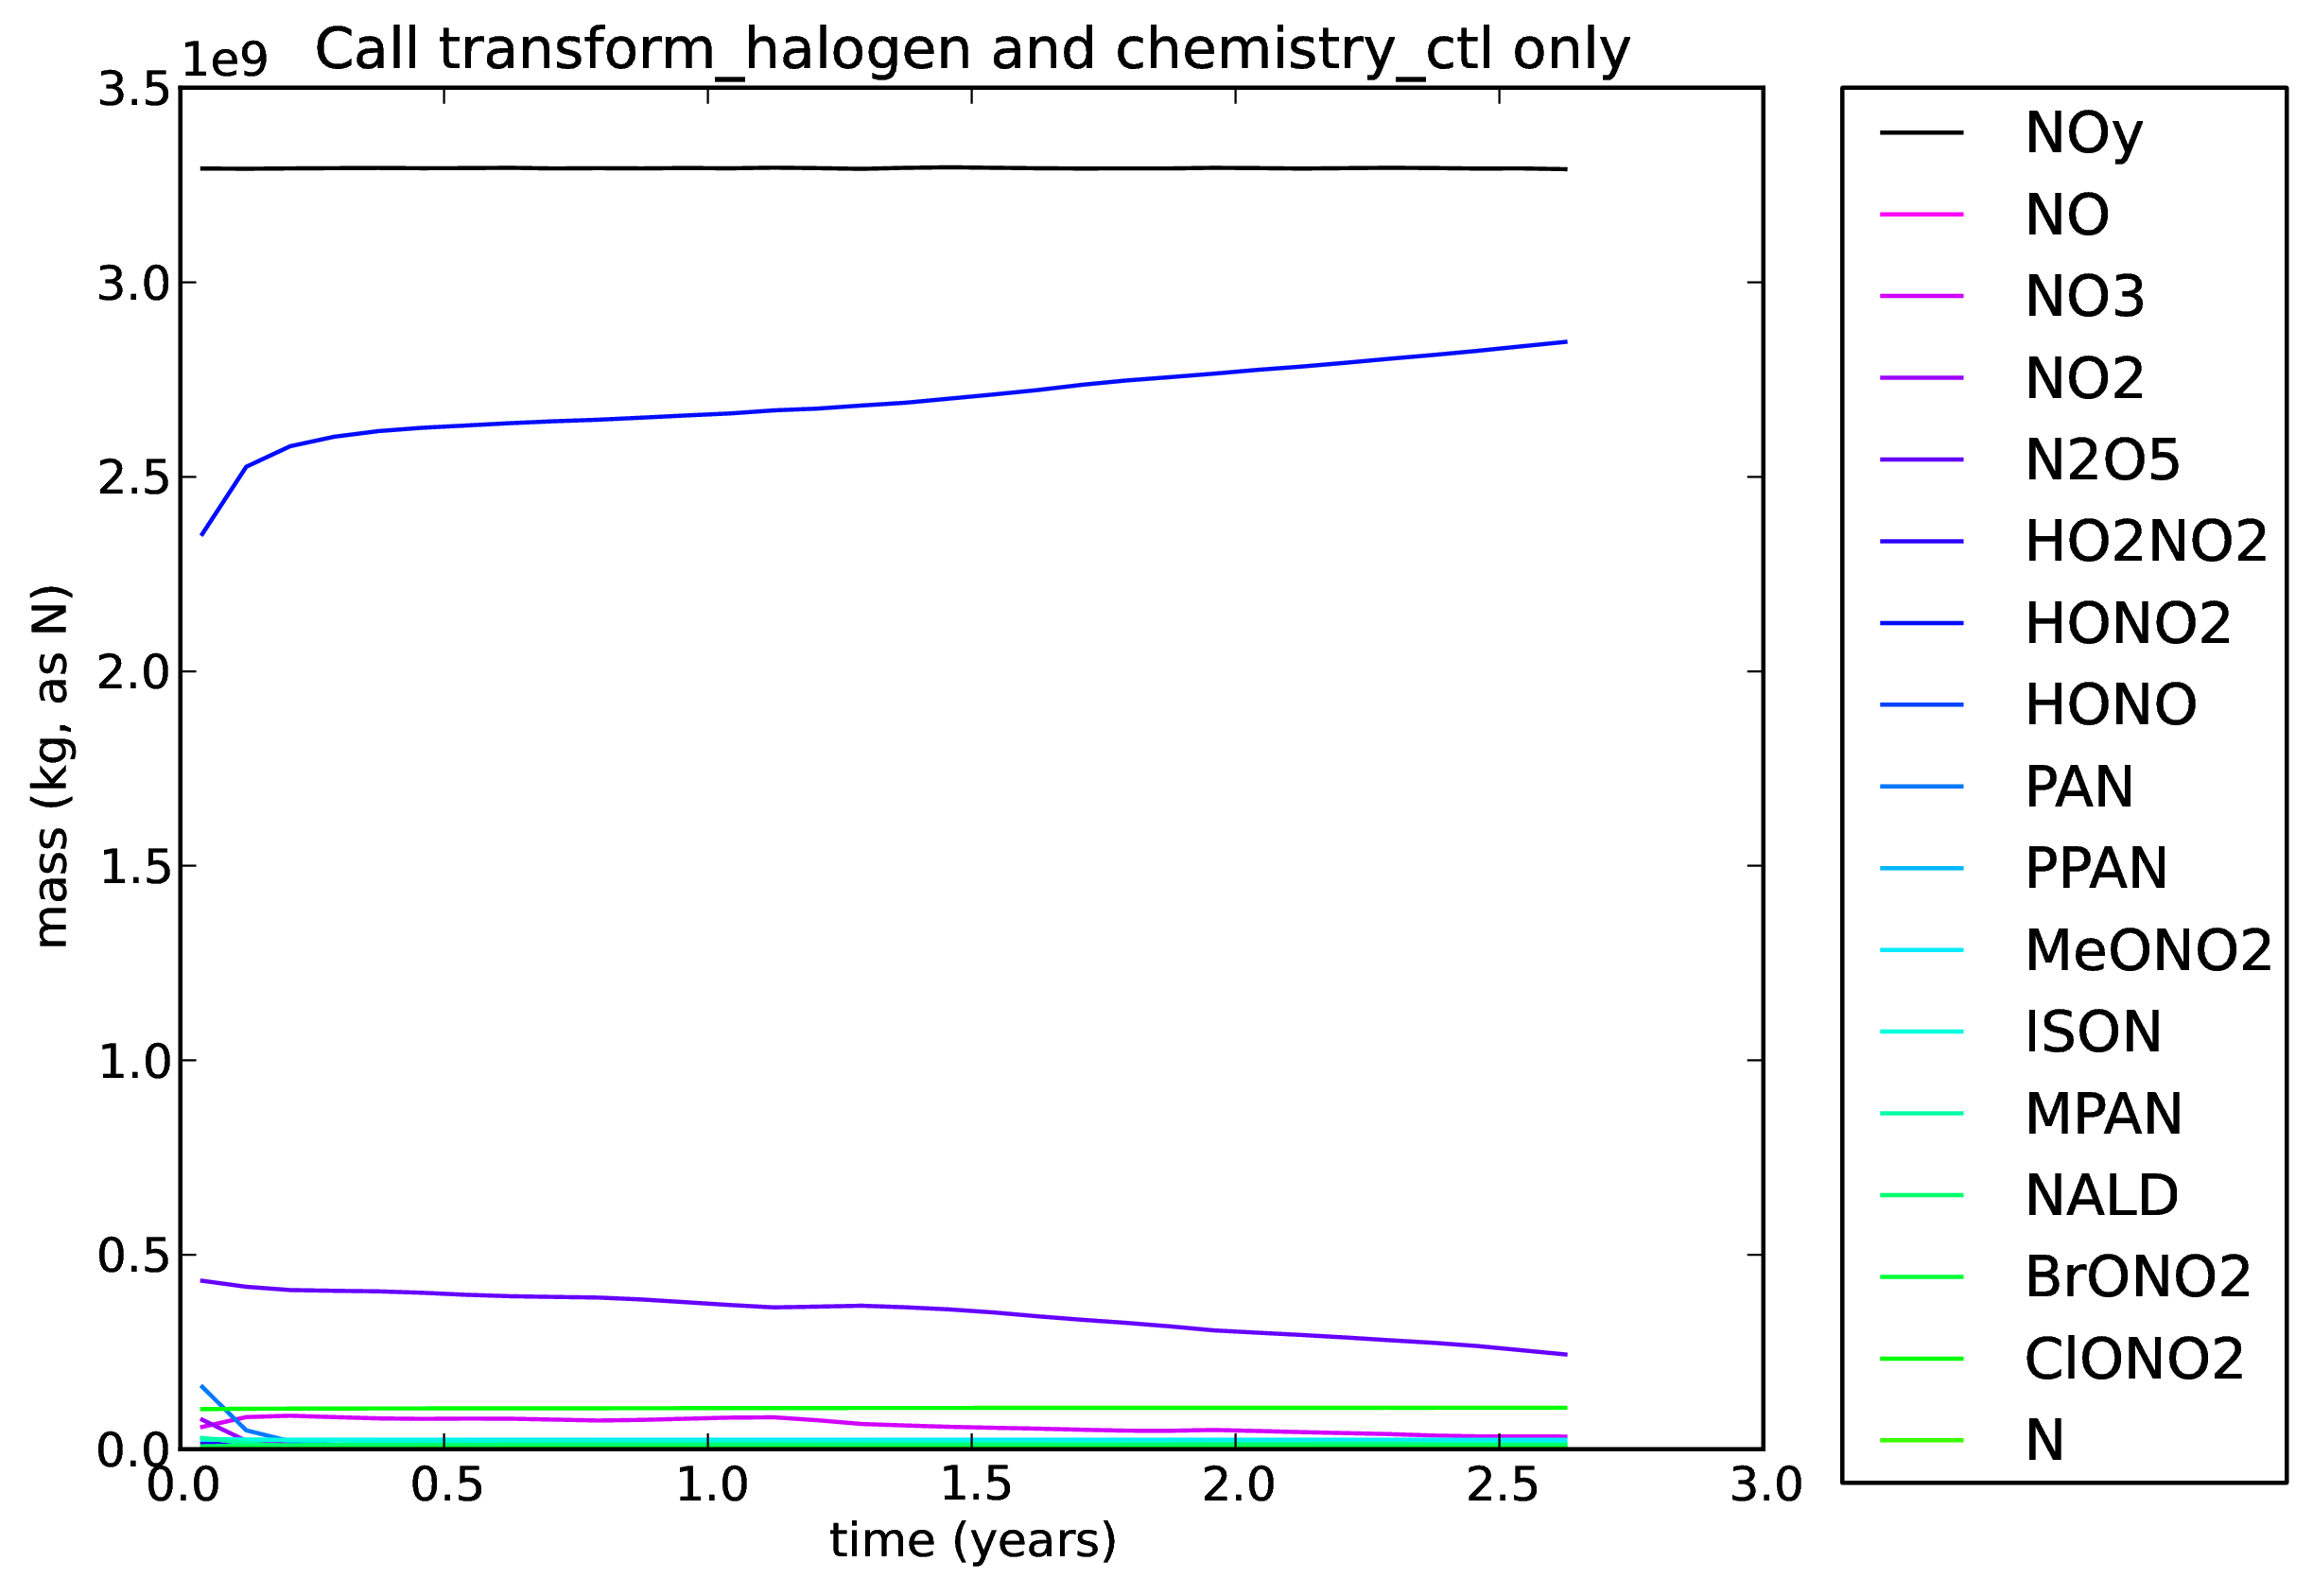
8. Call to transform_halogen and chemistry_ctl only
A copy of xkqhe was taken (including the doubled HNO3 initial condition), and the calls to transform_nitrogen were removed. The forward and backward calls to transform_halogen and chemistry_ctl were still included (there were still no calls to the emission_ctl fastjx, and aero_ctl). The photolysis rates were completely set to zero in this simulation. This is job xkqhf.
The image below shows the evolution of the total atmospheric mass of each of the NOy species, in kg(species). Note that NOy is given in kg(N), and the shorter x-axis.
As above (xkqhe), there should be changes to the NOy species, which may involve them increasing or decreasing during the course of the run.
All plots can be found here: ![]() ChemOnly_xkqhf.pdf
ChemOnly_xkqhf.pdf ![]()
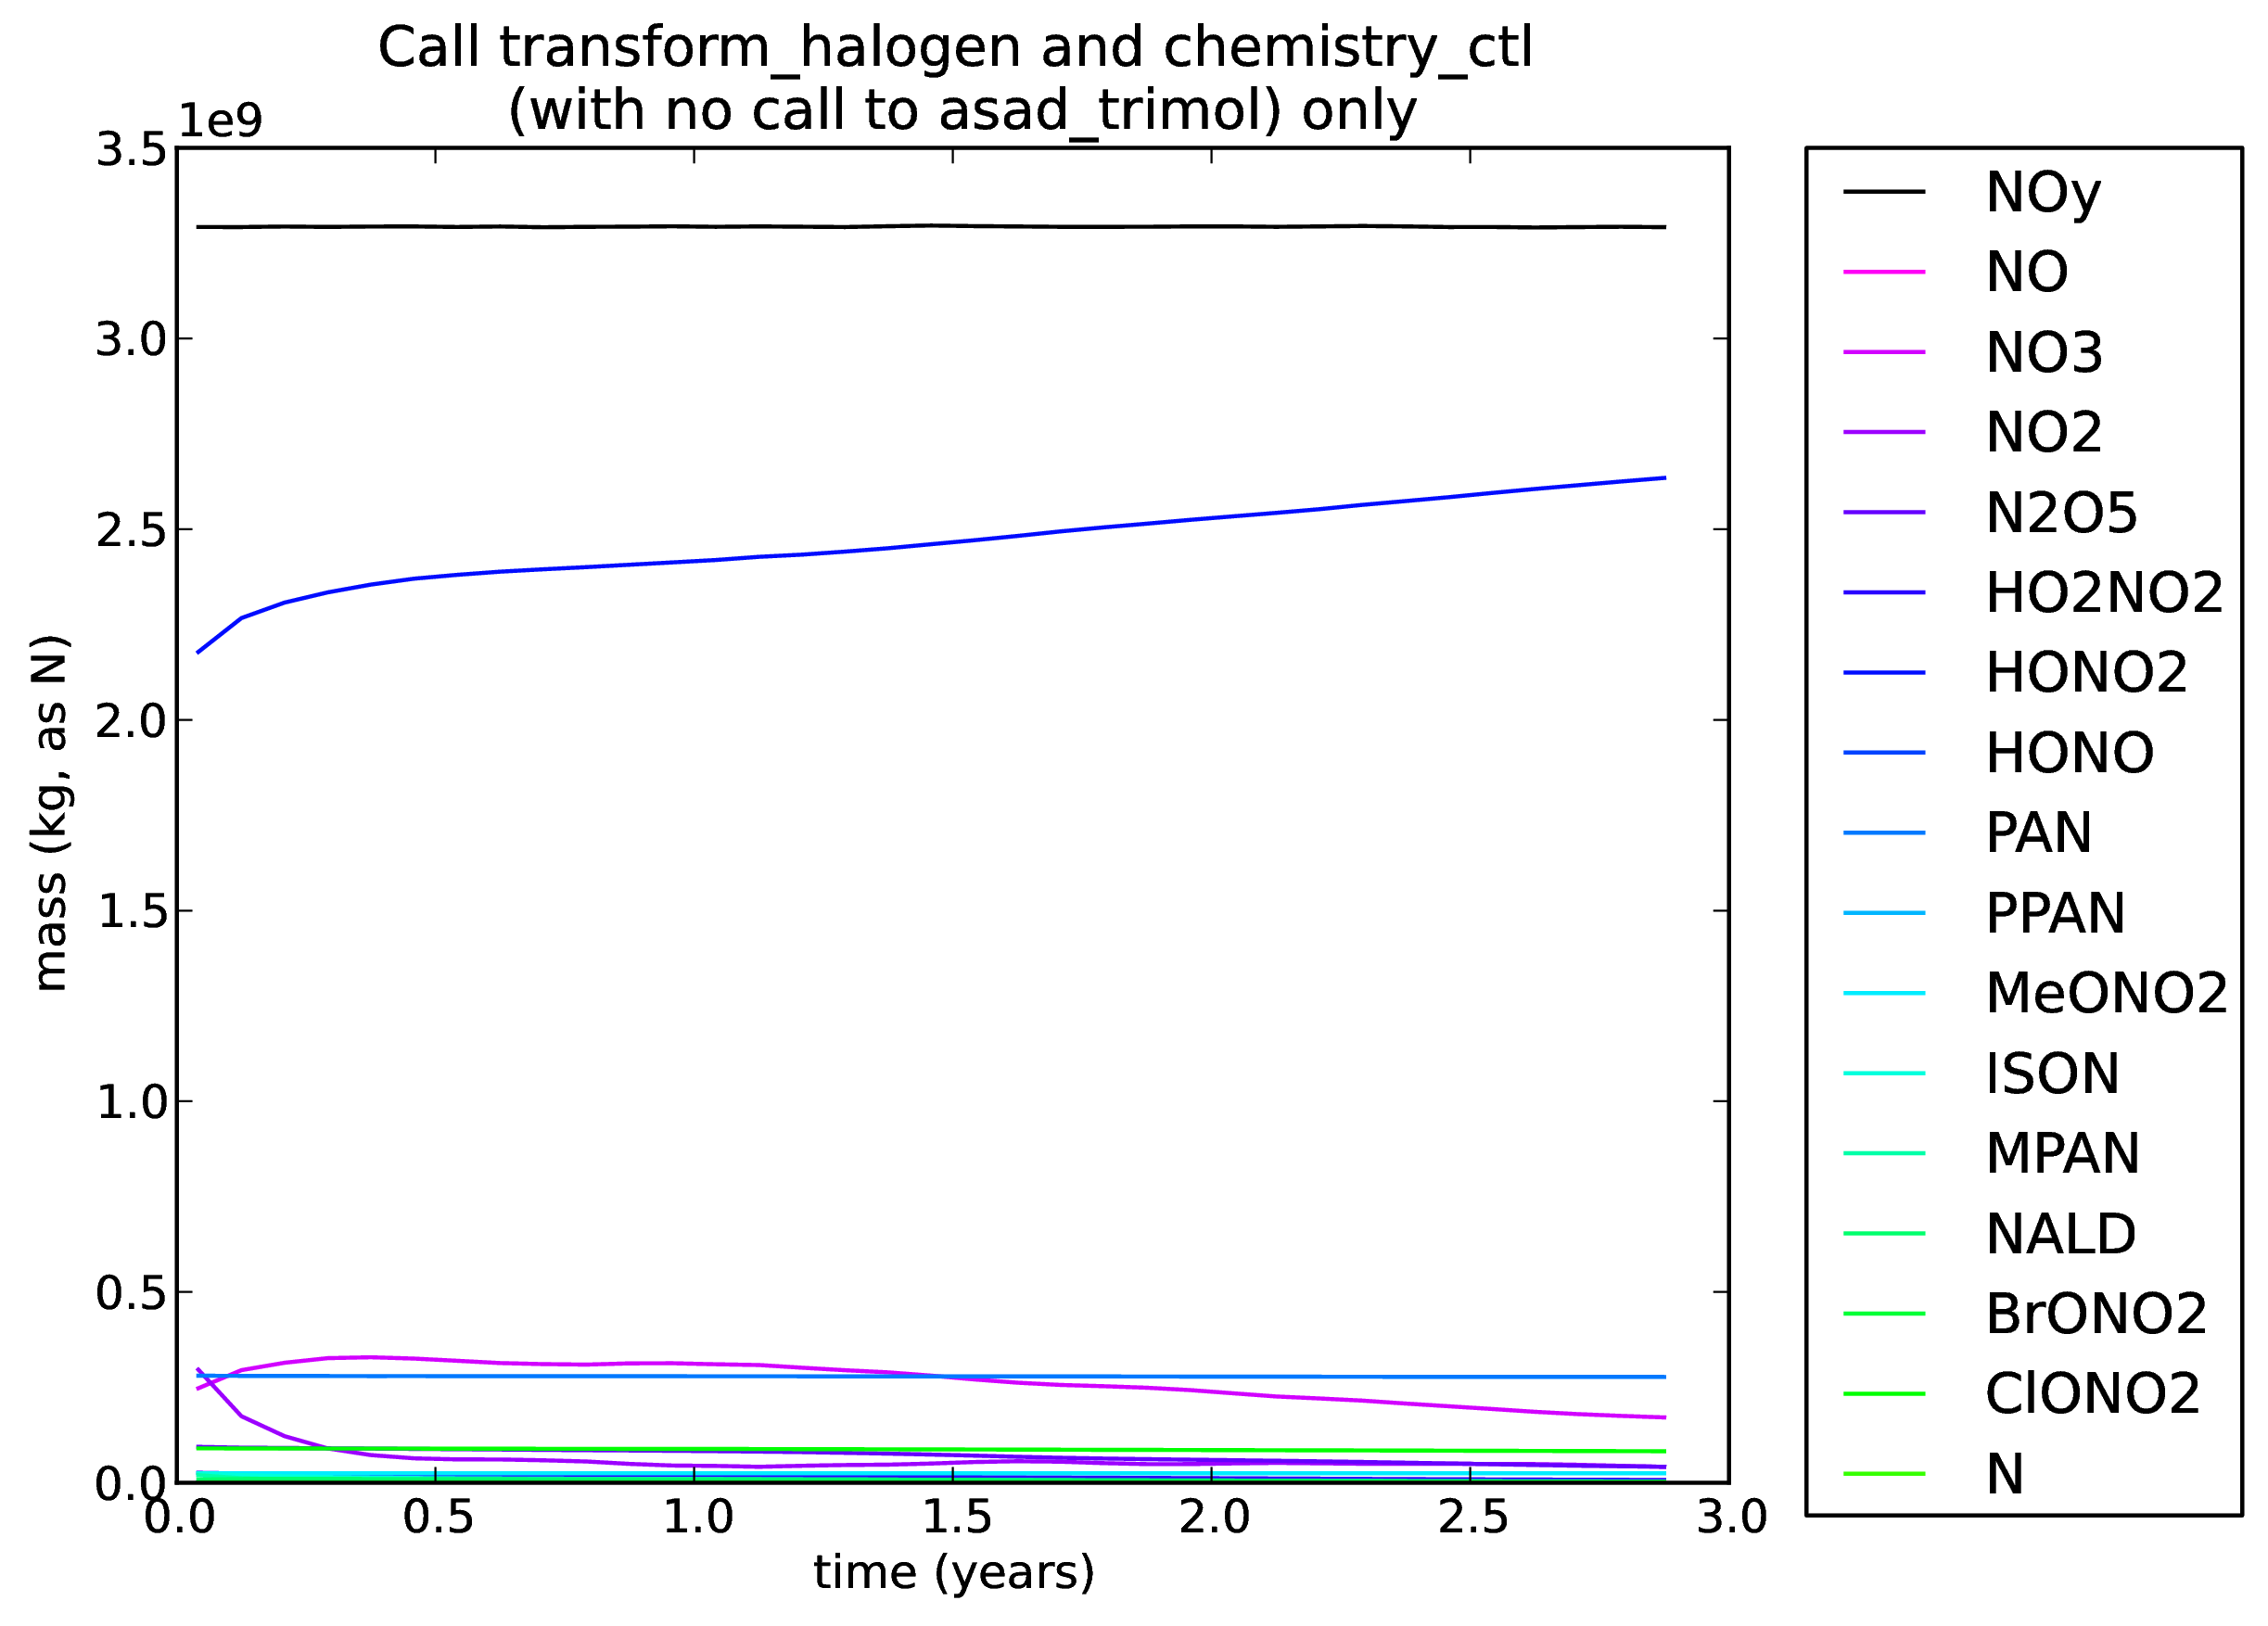
9. Call to transform_halogen and chemistry_ctl (with no call to asad_trimol) only
A copy of xkqhf was taken (including the doubled HNO3 initial condition). The forward and backward calls to transform_halogen and chemistry_ctl were still included (there were still no calls to the transform_nitrogen, emission_ctl fastjx, and aero_ctl). The photolysis rates were completely set to zero in this simulation. The call to asad_trimol was commended out in asad_cdrive, which means that there will be no termolecular reactions at all in this simulation. This is job xkqhg.
All plots from this run can be found here: ![]() NoTrimol_xkqhg.pdf
NoTrimol_xkqhg.pdf ![]()
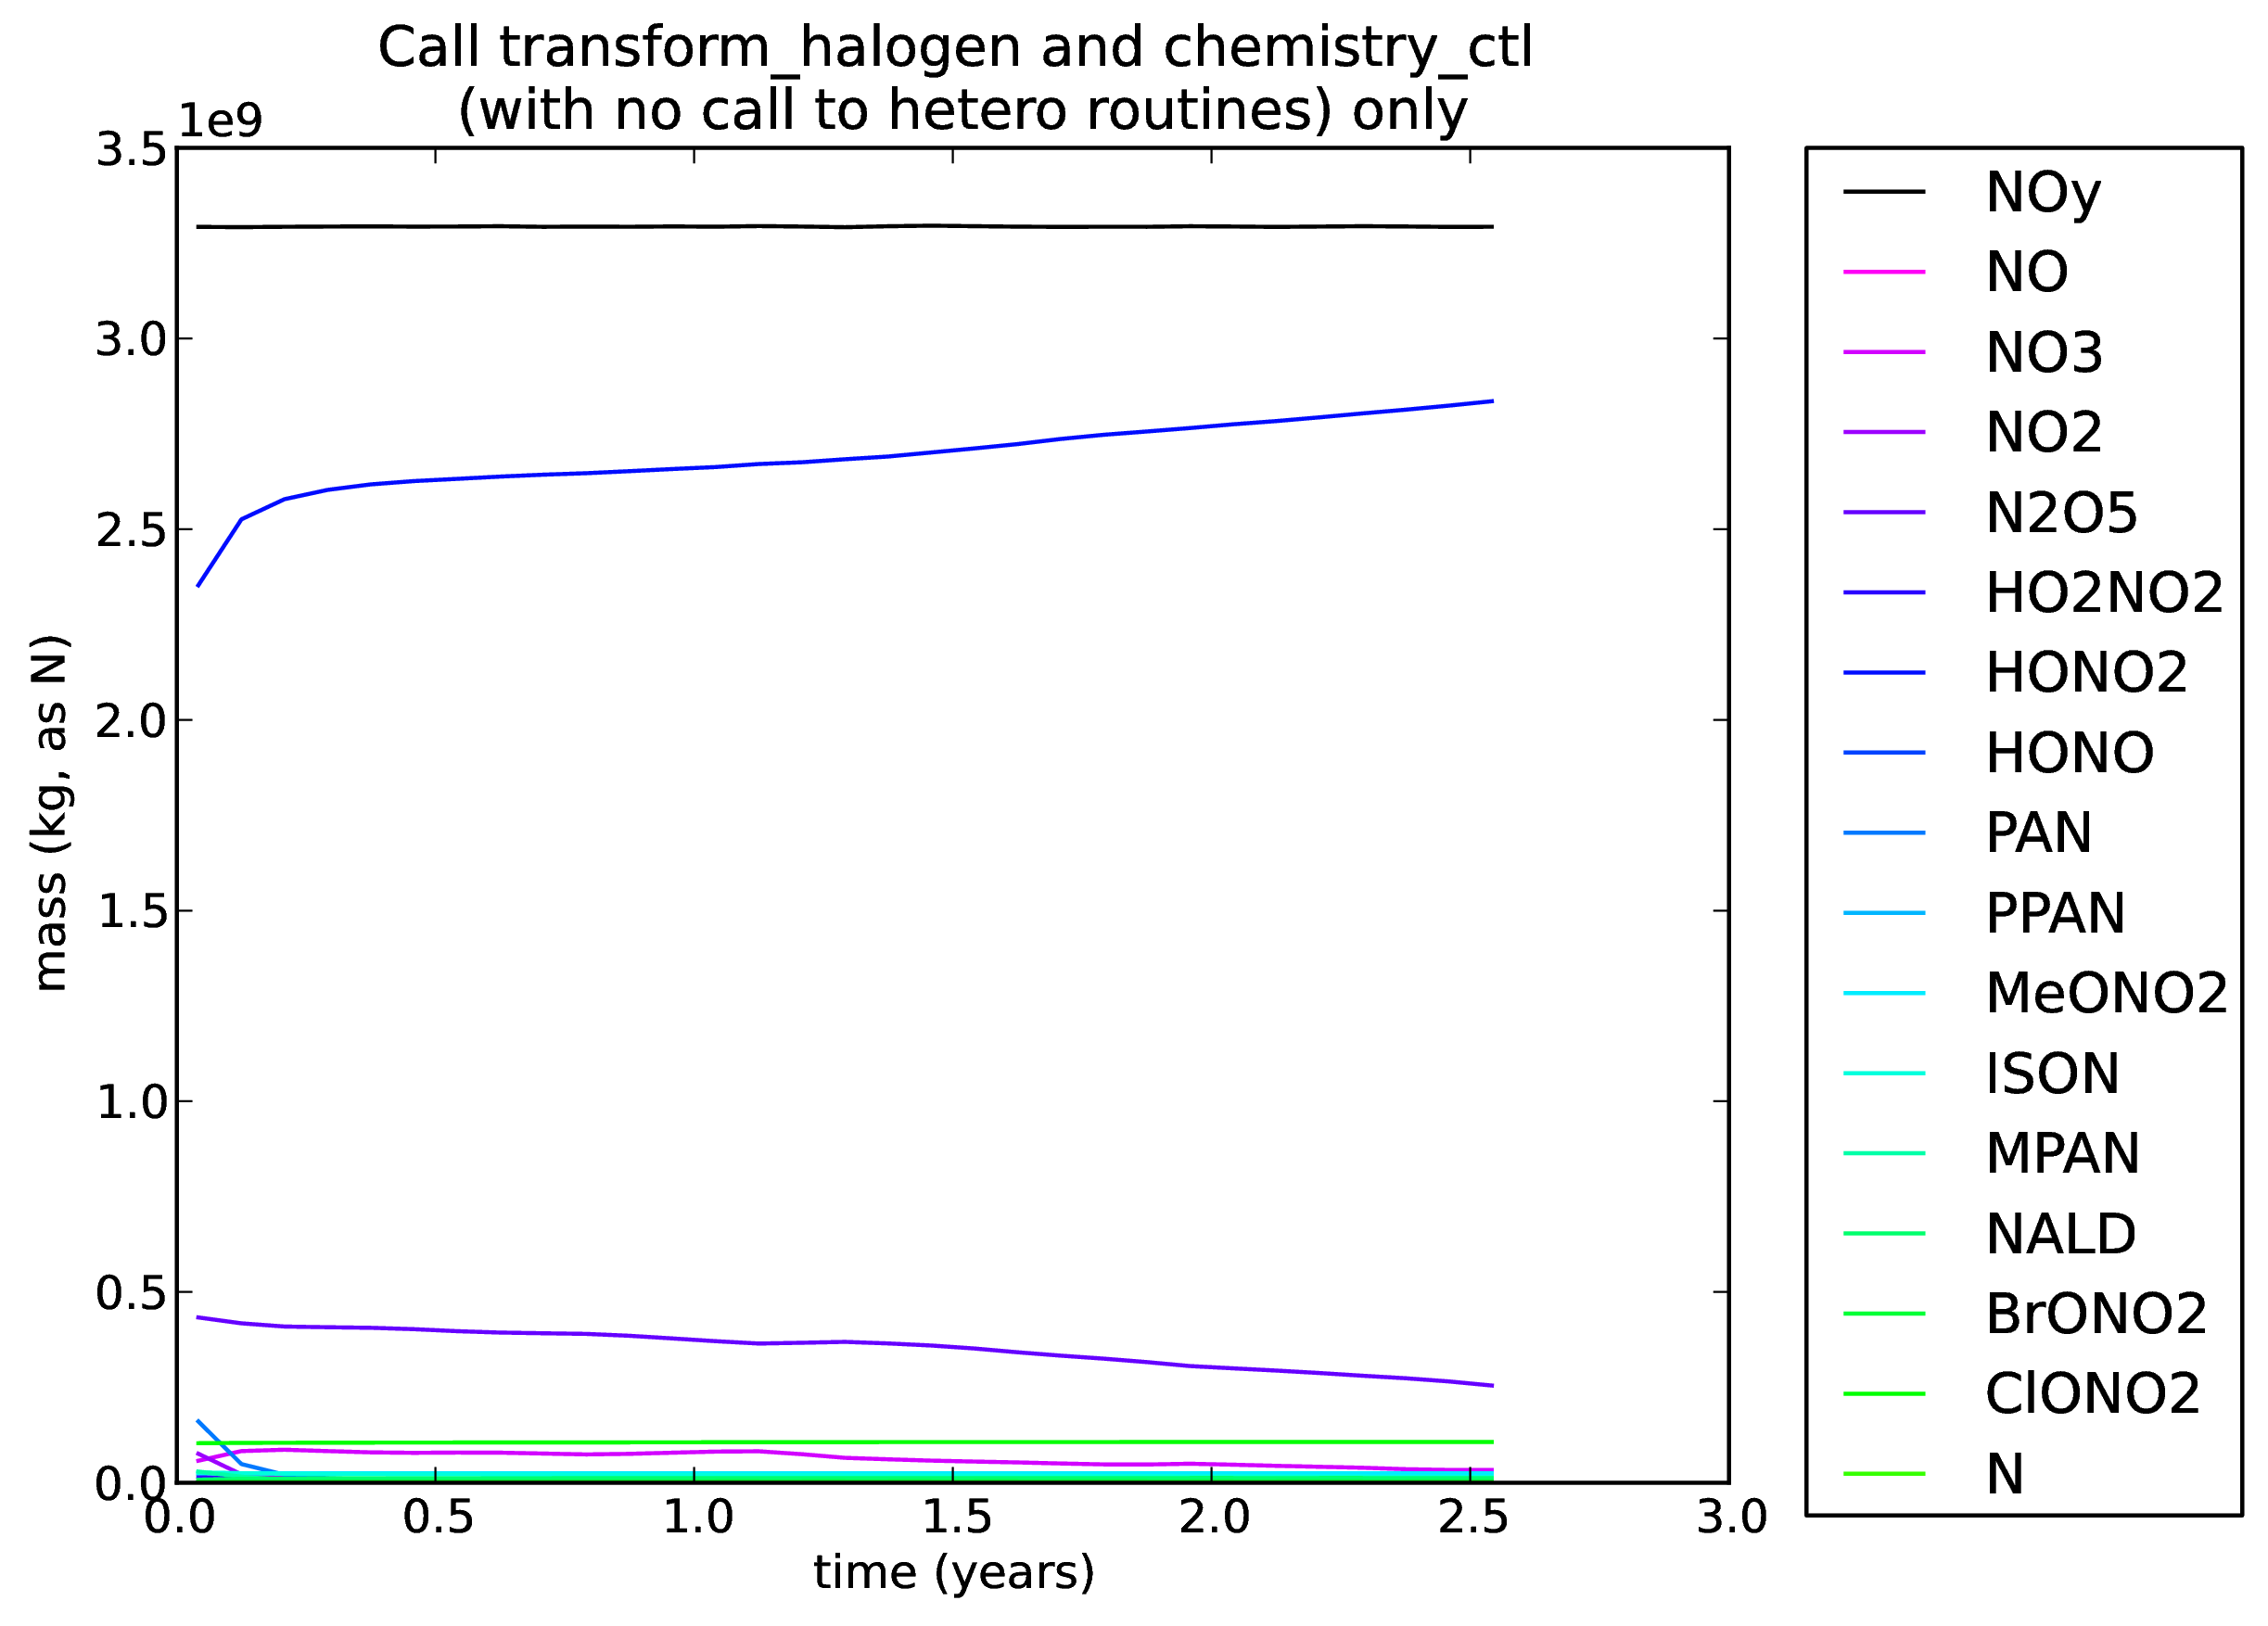
10. Call to transform_halogen and chemistry_ctl (with no call to hetero routines) only
A copy of xkqhg was taken (including the doubled HNO3 initial condition). The forward and backward calls to transform_halogen and chemistry_ctl were still included (there were still no calls to the transform_nitrogen, emission_ctl fastjx, and aero_ctl). The photolysis rates were completely set to zero in this simulation. The call to asad_trimol was put back in in asad_cdrive, but all heterogeneous routines in asad_cdrive were commented out. This is job xkqhh.
All plots from this run can be found here: ![]() NoHetero_xkqhh.pdf
NoHetero_xkqhh.pdf ![]()
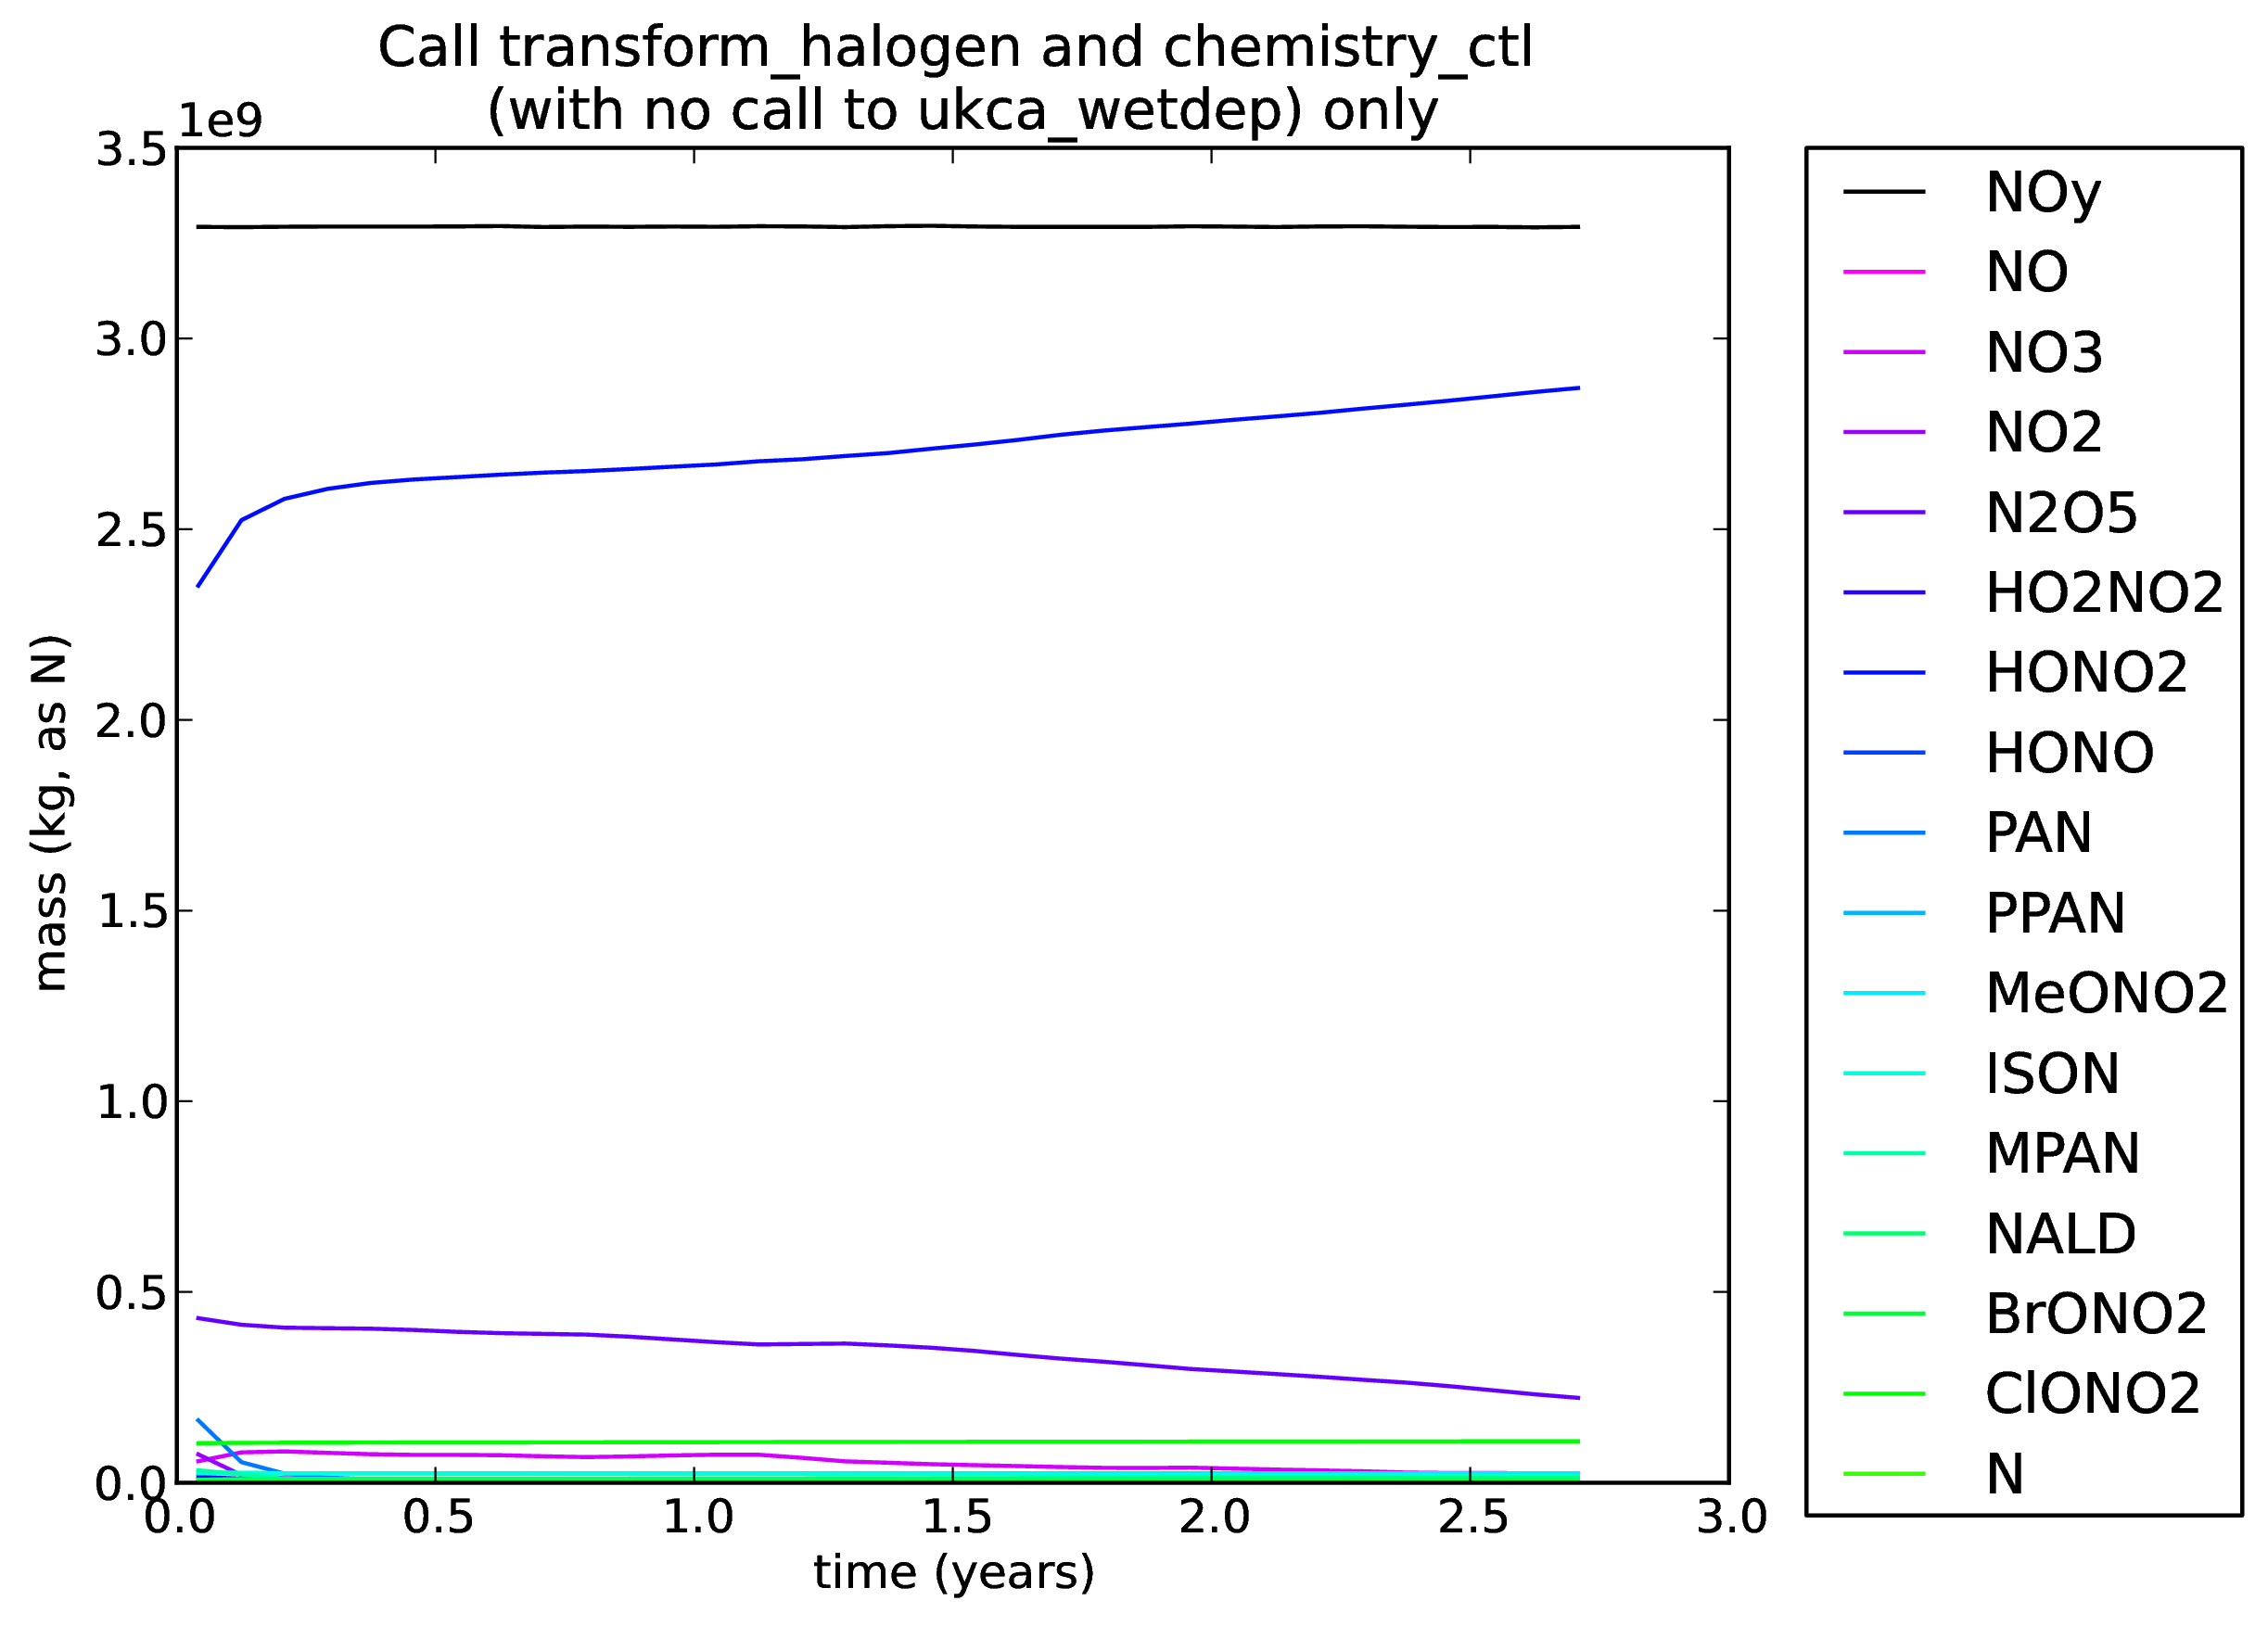
11. Call to transform_halogen and chemistry_ctl (with no call to ukca_wetdep) only
A copy of xkqhh was taken (including the doubled HNO3 initial condition). The forward and backward calls to transform_halogen and chemistry_ctl were still included (there were still no calls to the transform_nitrogen, emission_ctl fastjx, and aero_ctl). The photolysis rates were completely set to zero in this simulation. The calls to the heterogeneous routines in asad_cdrive were put back in, but the call to ukca_wetdep was commented out, meaning that there will be no wet deposition of any species. This is job xkqhi.
All plots from this run can be found here: ![]() NoWetDep_xkqhi.pdf
NoWetDep_xkqhi.pdf ![]()
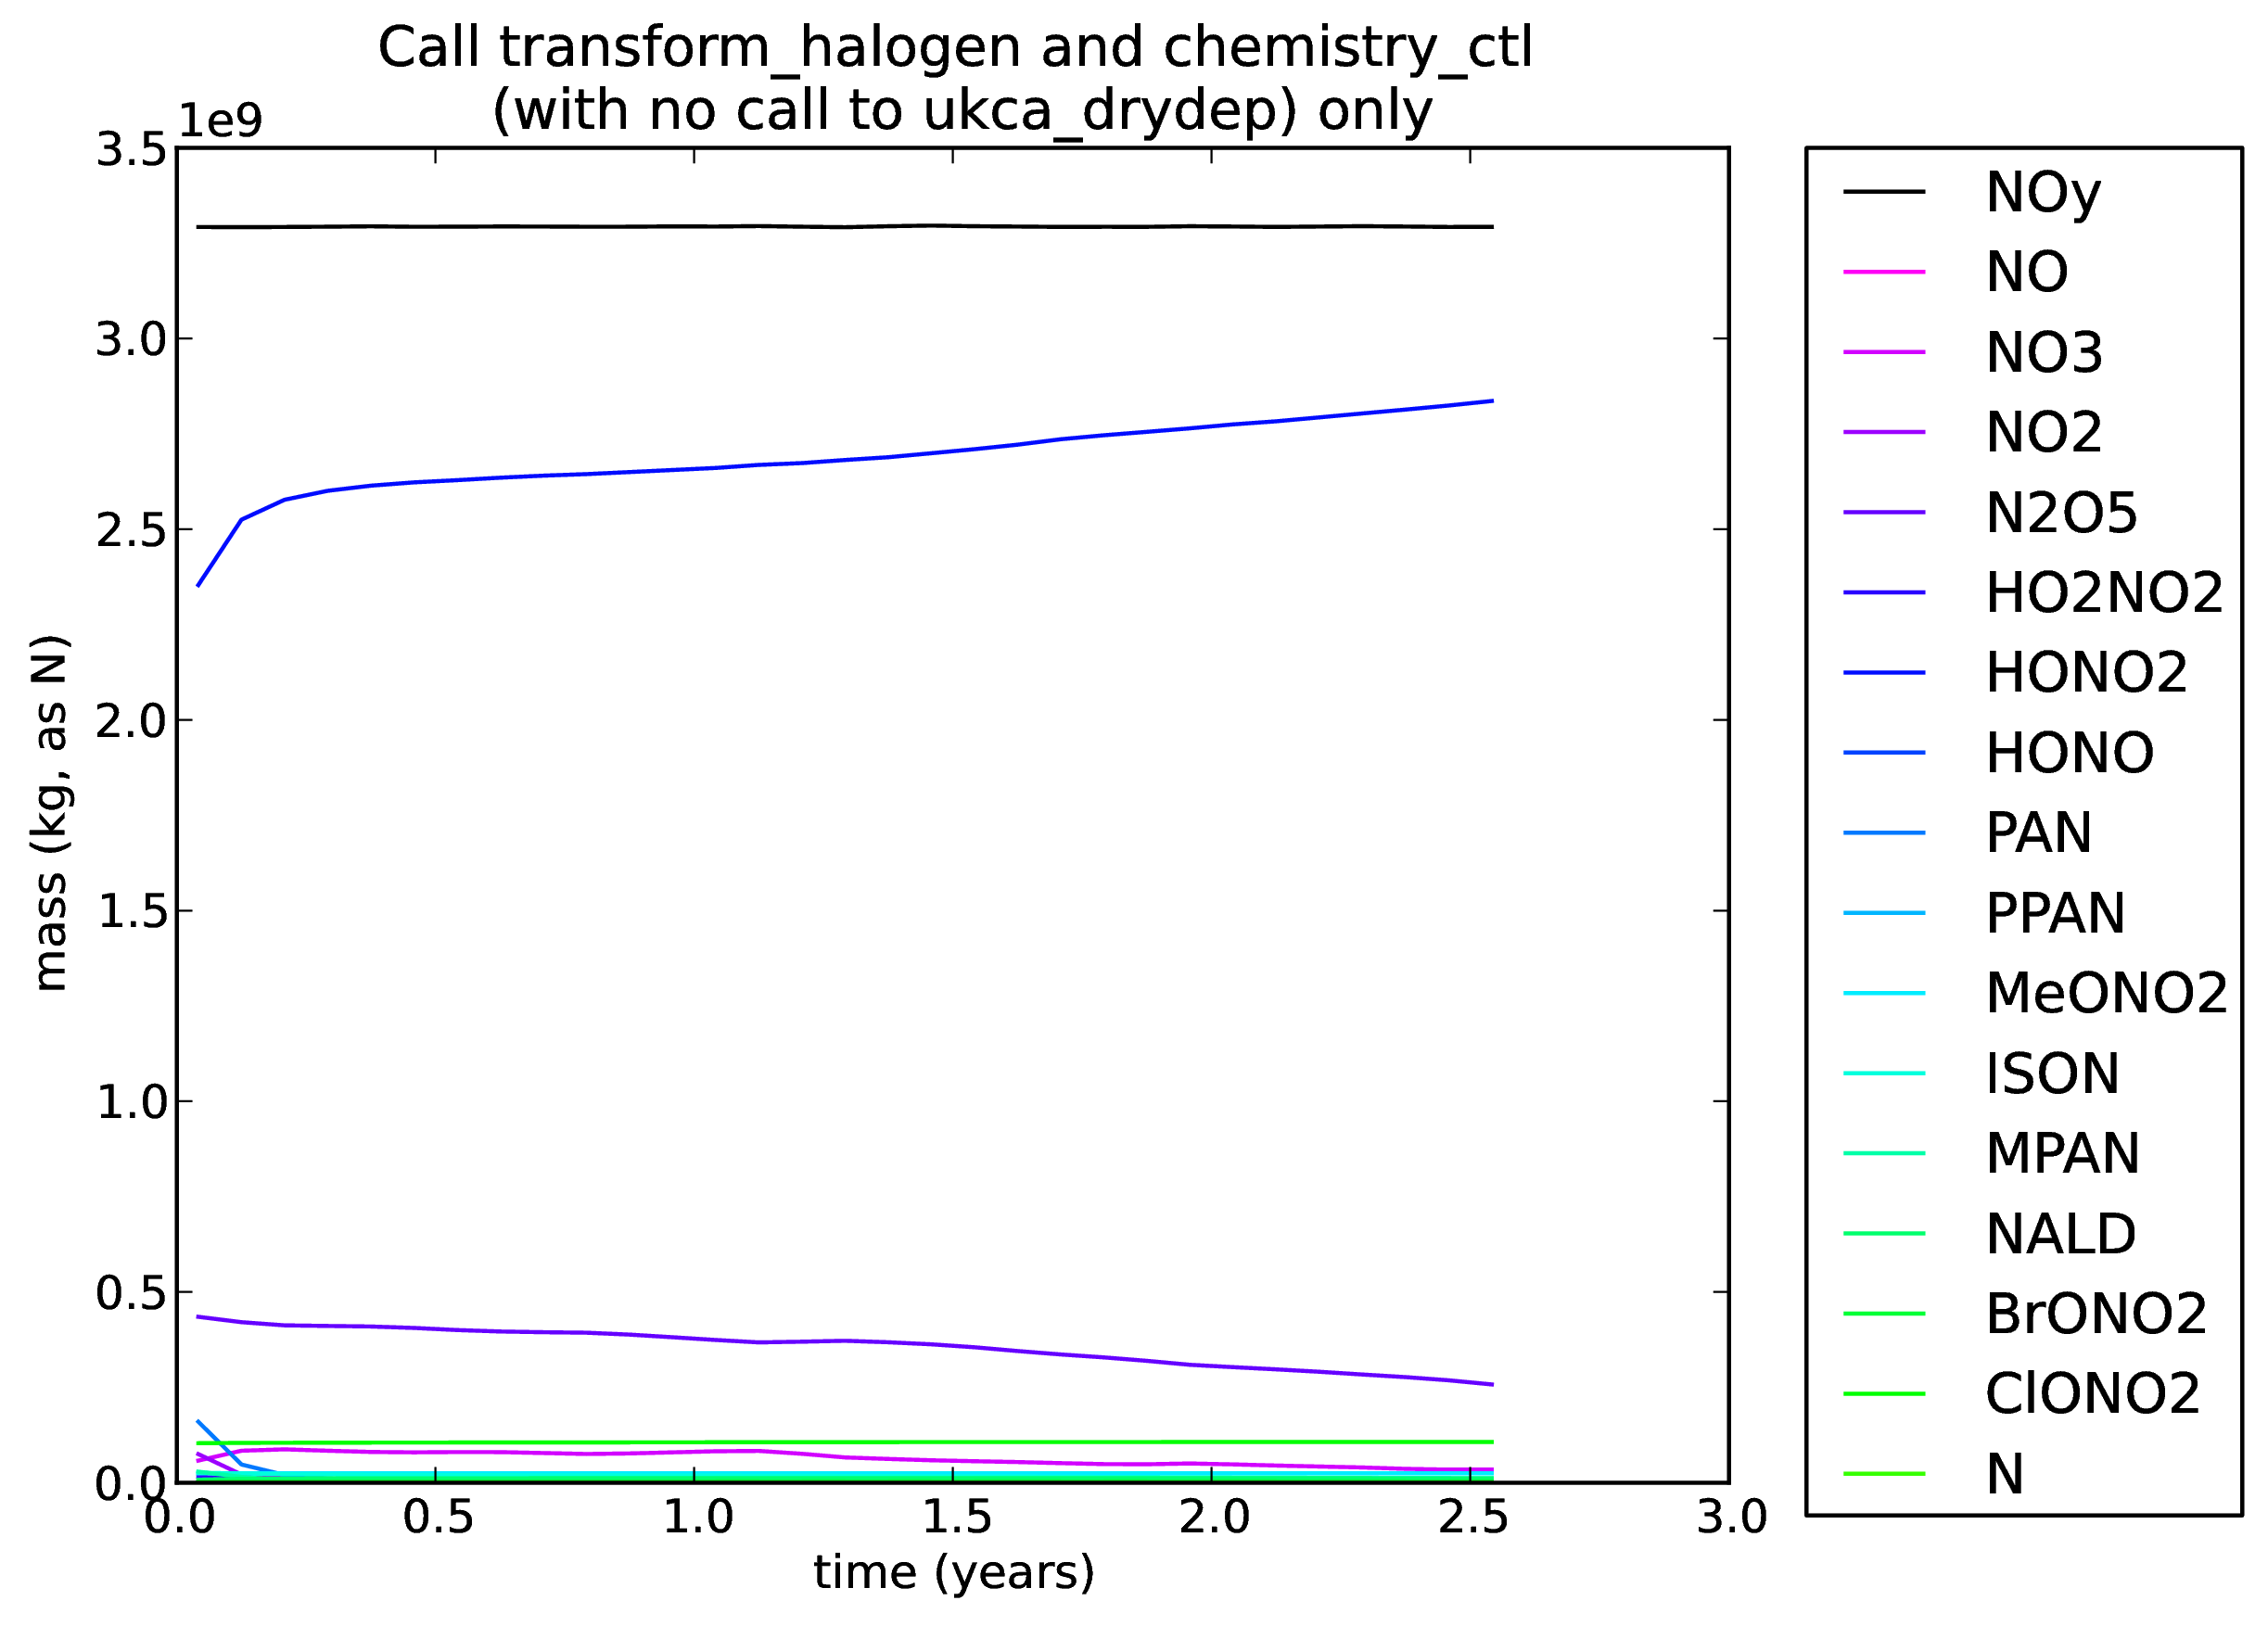
12. Call to transform_halogen and chemistry_ctl (with no call to ukca_drydep) only
A copy of xkqhi was taken (including the doubled HNO3 initial condition). The forward and backward calls to transform_halogen and chemistry_ctl were still included (there were still no calls to the transform_nitrogen, emission_ctl fastjx, and aero_ctl). The photolysis rates were completely set to zero in this simulation. The call to ukca_wetdep in asad_cdrive was put back in, but the call to ukca_drydep was commented out, meaning that there will be no wet deposition of any species. This is job xkqhj.
All plots from this run can be found here: ![]() NoDryDep_xkqhj.pdf
NoDryDep_xkqhj.pdf ![]()
Planned Tests
There are a number of planned tests:
- Double N2O+(O1D) rate as done at vn7.3
- Run the NoSourceSink (xjciv) in 2 new ways:
- Set all rates of NOy involved reactions to zero
- Remove all NOy involved reactions
The latter two should give equivalent results, assuming that there is no overwriting being done in asad_bimol or asad_trimol.
New Results
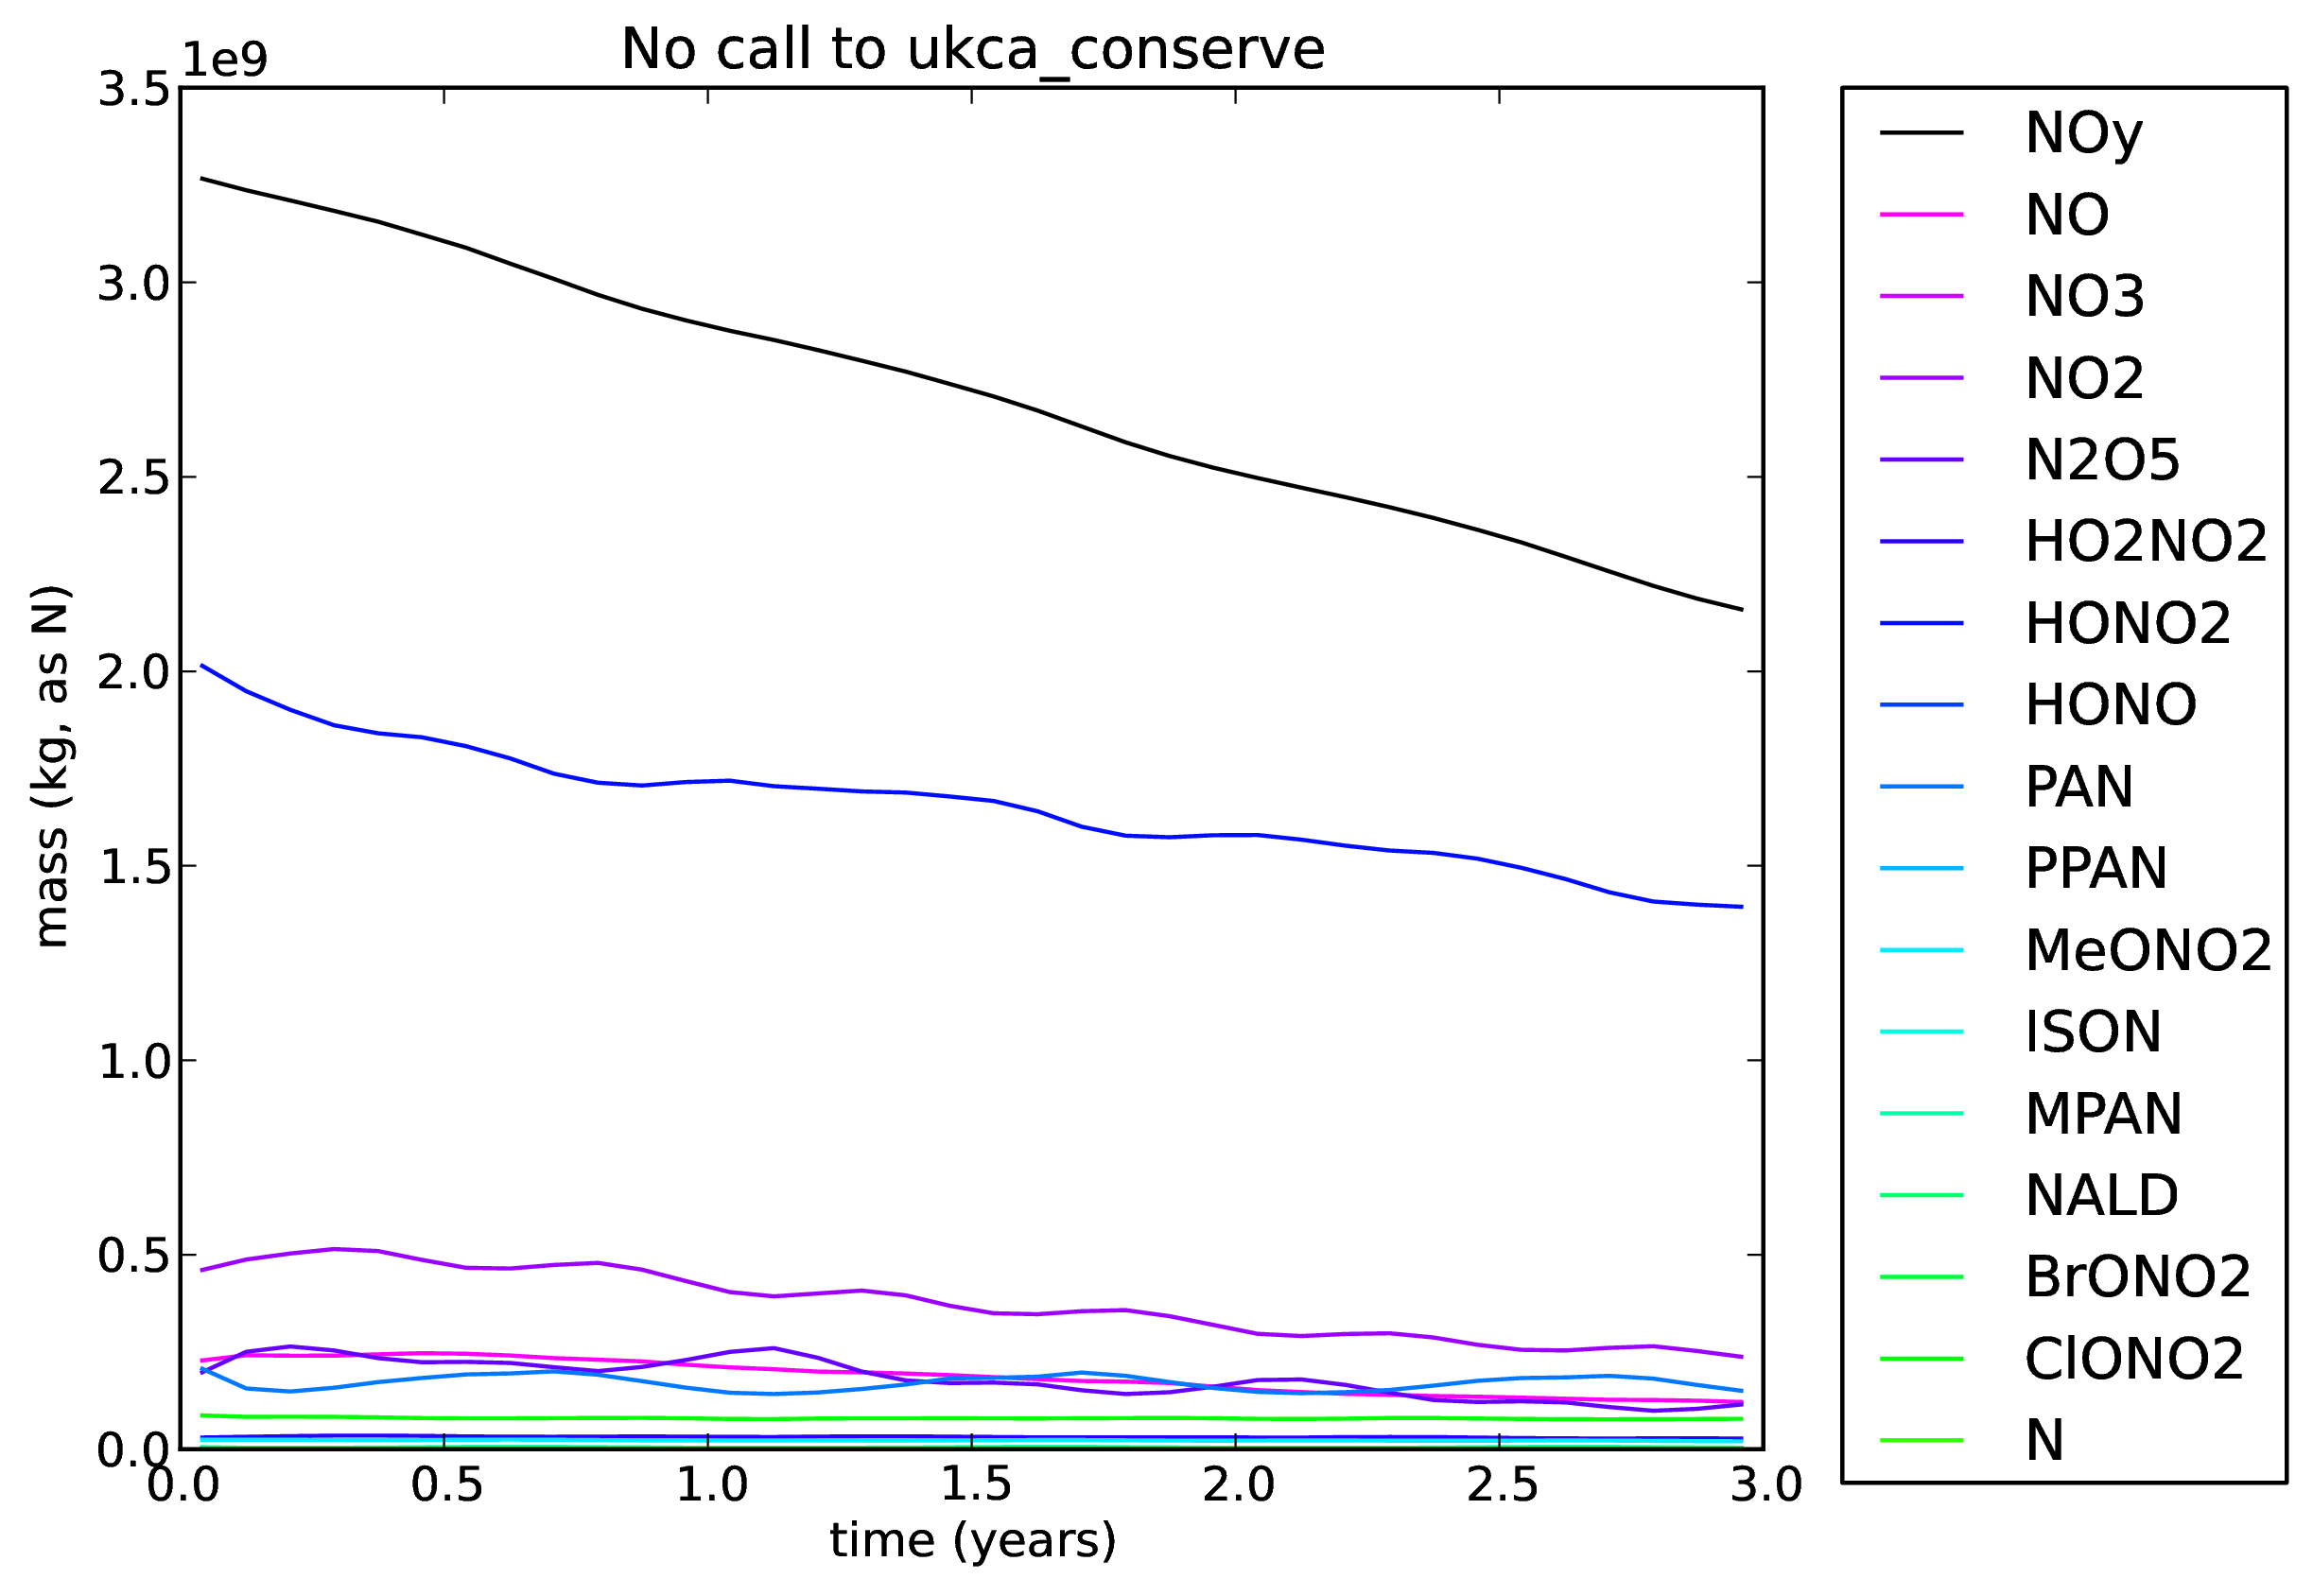
A number of others tests were run, listed below. When plotting these, it was realised that the NO2 contribution had not been included in the original plots above - this has now been corrected.
13. No call to conserve
A copy of xjciv was taken (including the doubled HNO3 initial condition). The call to the conserve routine was removed. This is job xkqha.
All plots from this run can be found here: ![]() NoConserve_xkqha.pdf
NoConserve_xkqha.pdf ![]()
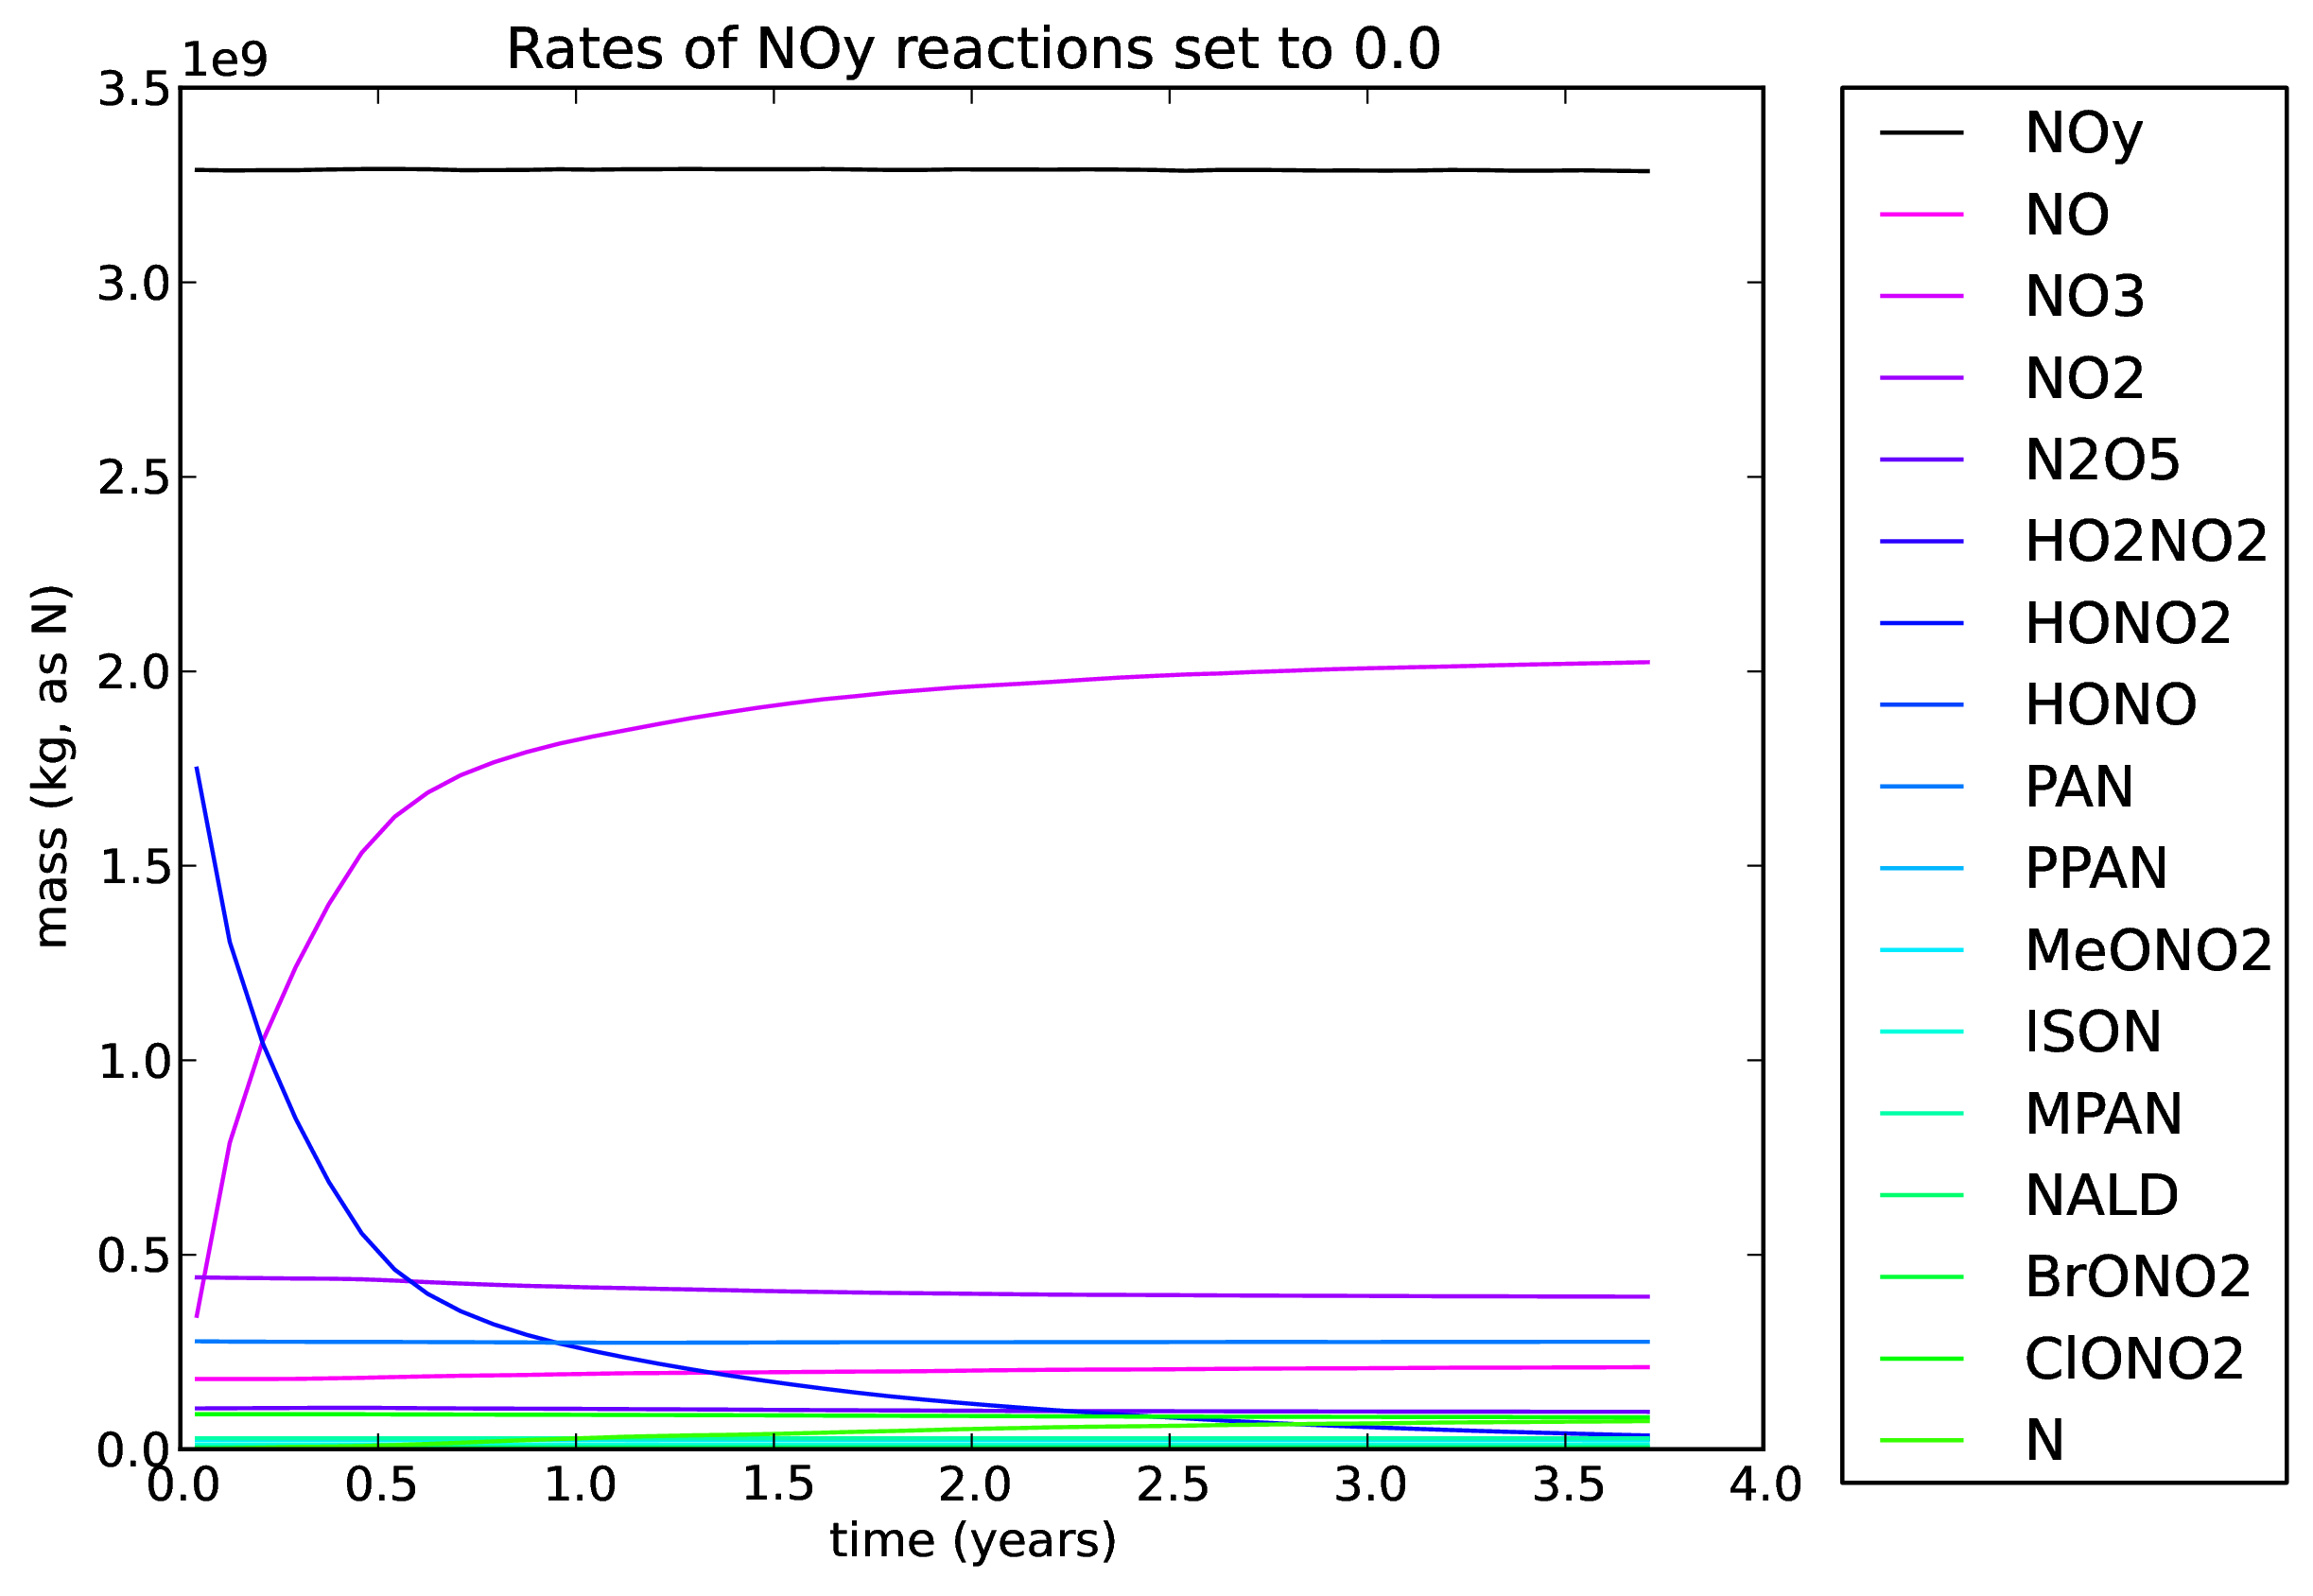
14. NOy interconversion reaction rates set to zero
A copy of xjciv was taken (including the doubled HNO3 initial condition). The rates of all NOy interconversion reactions in ukca_chem_strattrop were set to zero. This is job xlbqa.
All plots from this run can be found here: ![]() RatesToZero_xlbqa.pdf
RatesToZero_xlbqa.pdf ![]()
One of the dependent reactions was still in place, but this does not affect the NOy conservation.
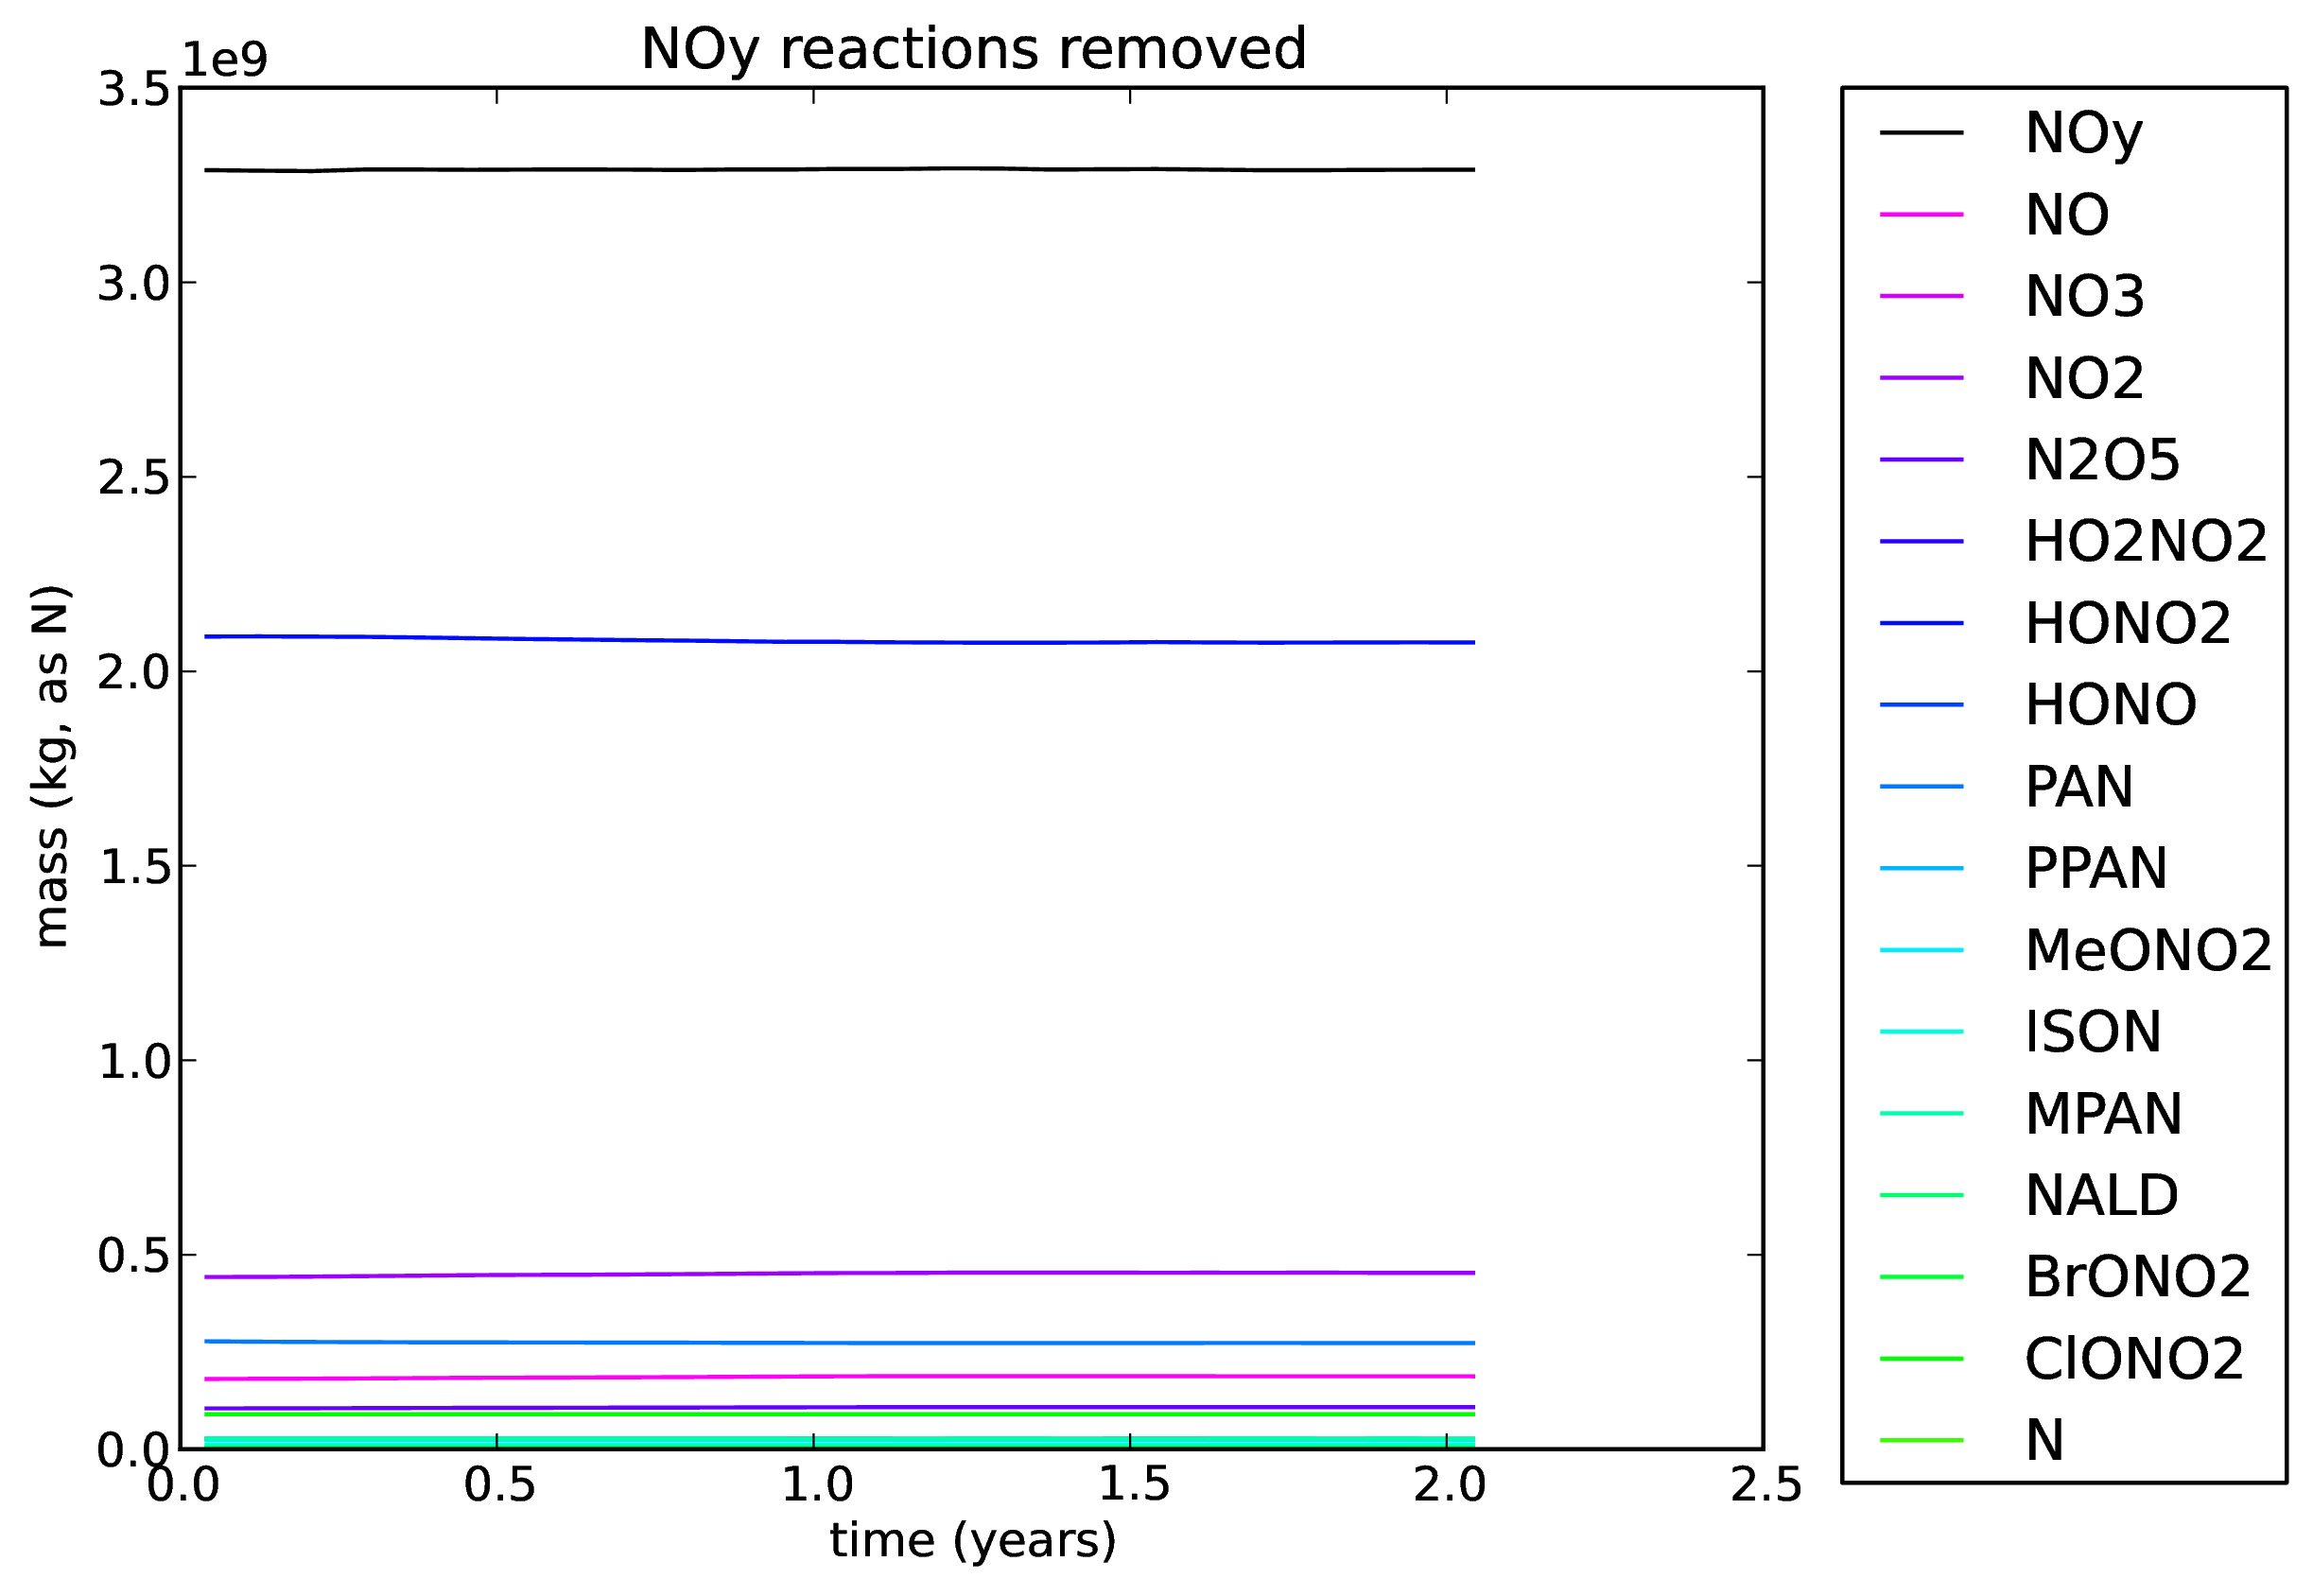
15. NOy interconversion reactions removed
A copy of xjciv was taken (including the doubled HNO3 initial condition). All NOy interconversion reactions in ukca_chem_strattrop were removed. This is job xlbqb.
All plots from this run can be found here: ![]() RatesRemoved_xlbqb.pdf
RatesRemoved_xlbqb.pdf ![]()
Zonal-mean tendency plots can be found here: ![]() RatesRemoved_xlbqb_NOy_UKCA_tendency.pdf
RatesRemoved_xlbqb_NOy_UKCA_tendency.pdf ![]()
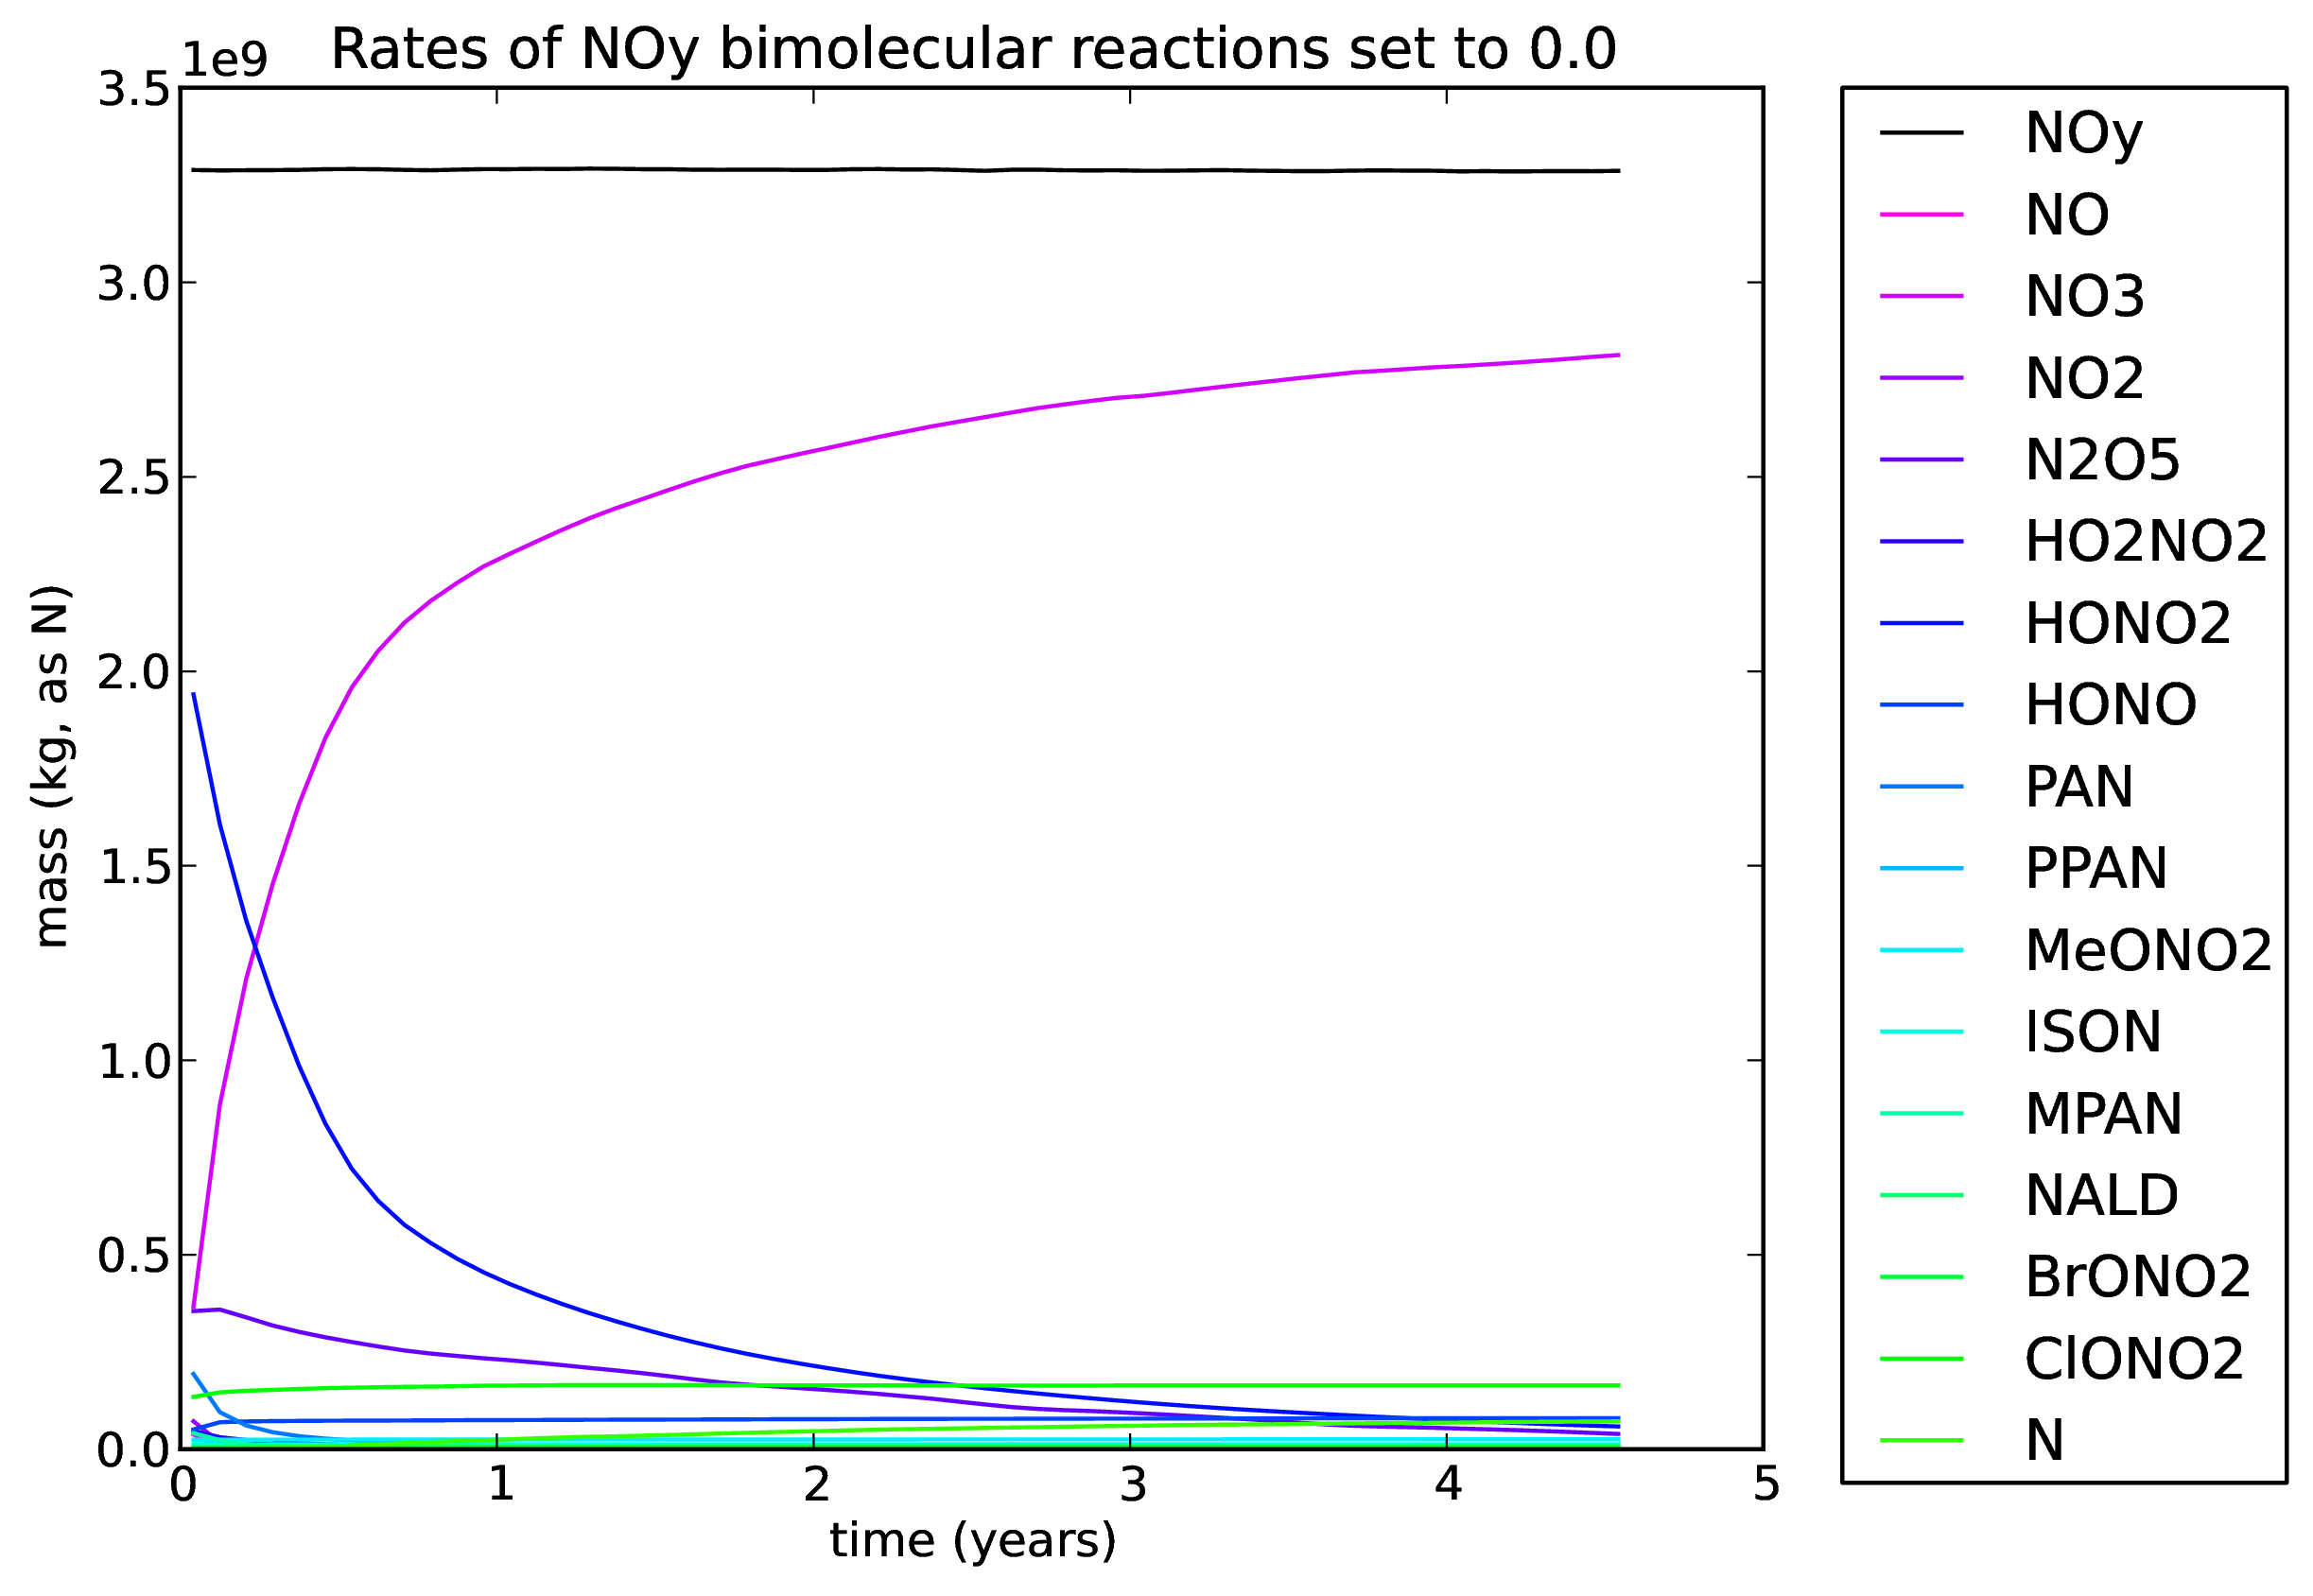
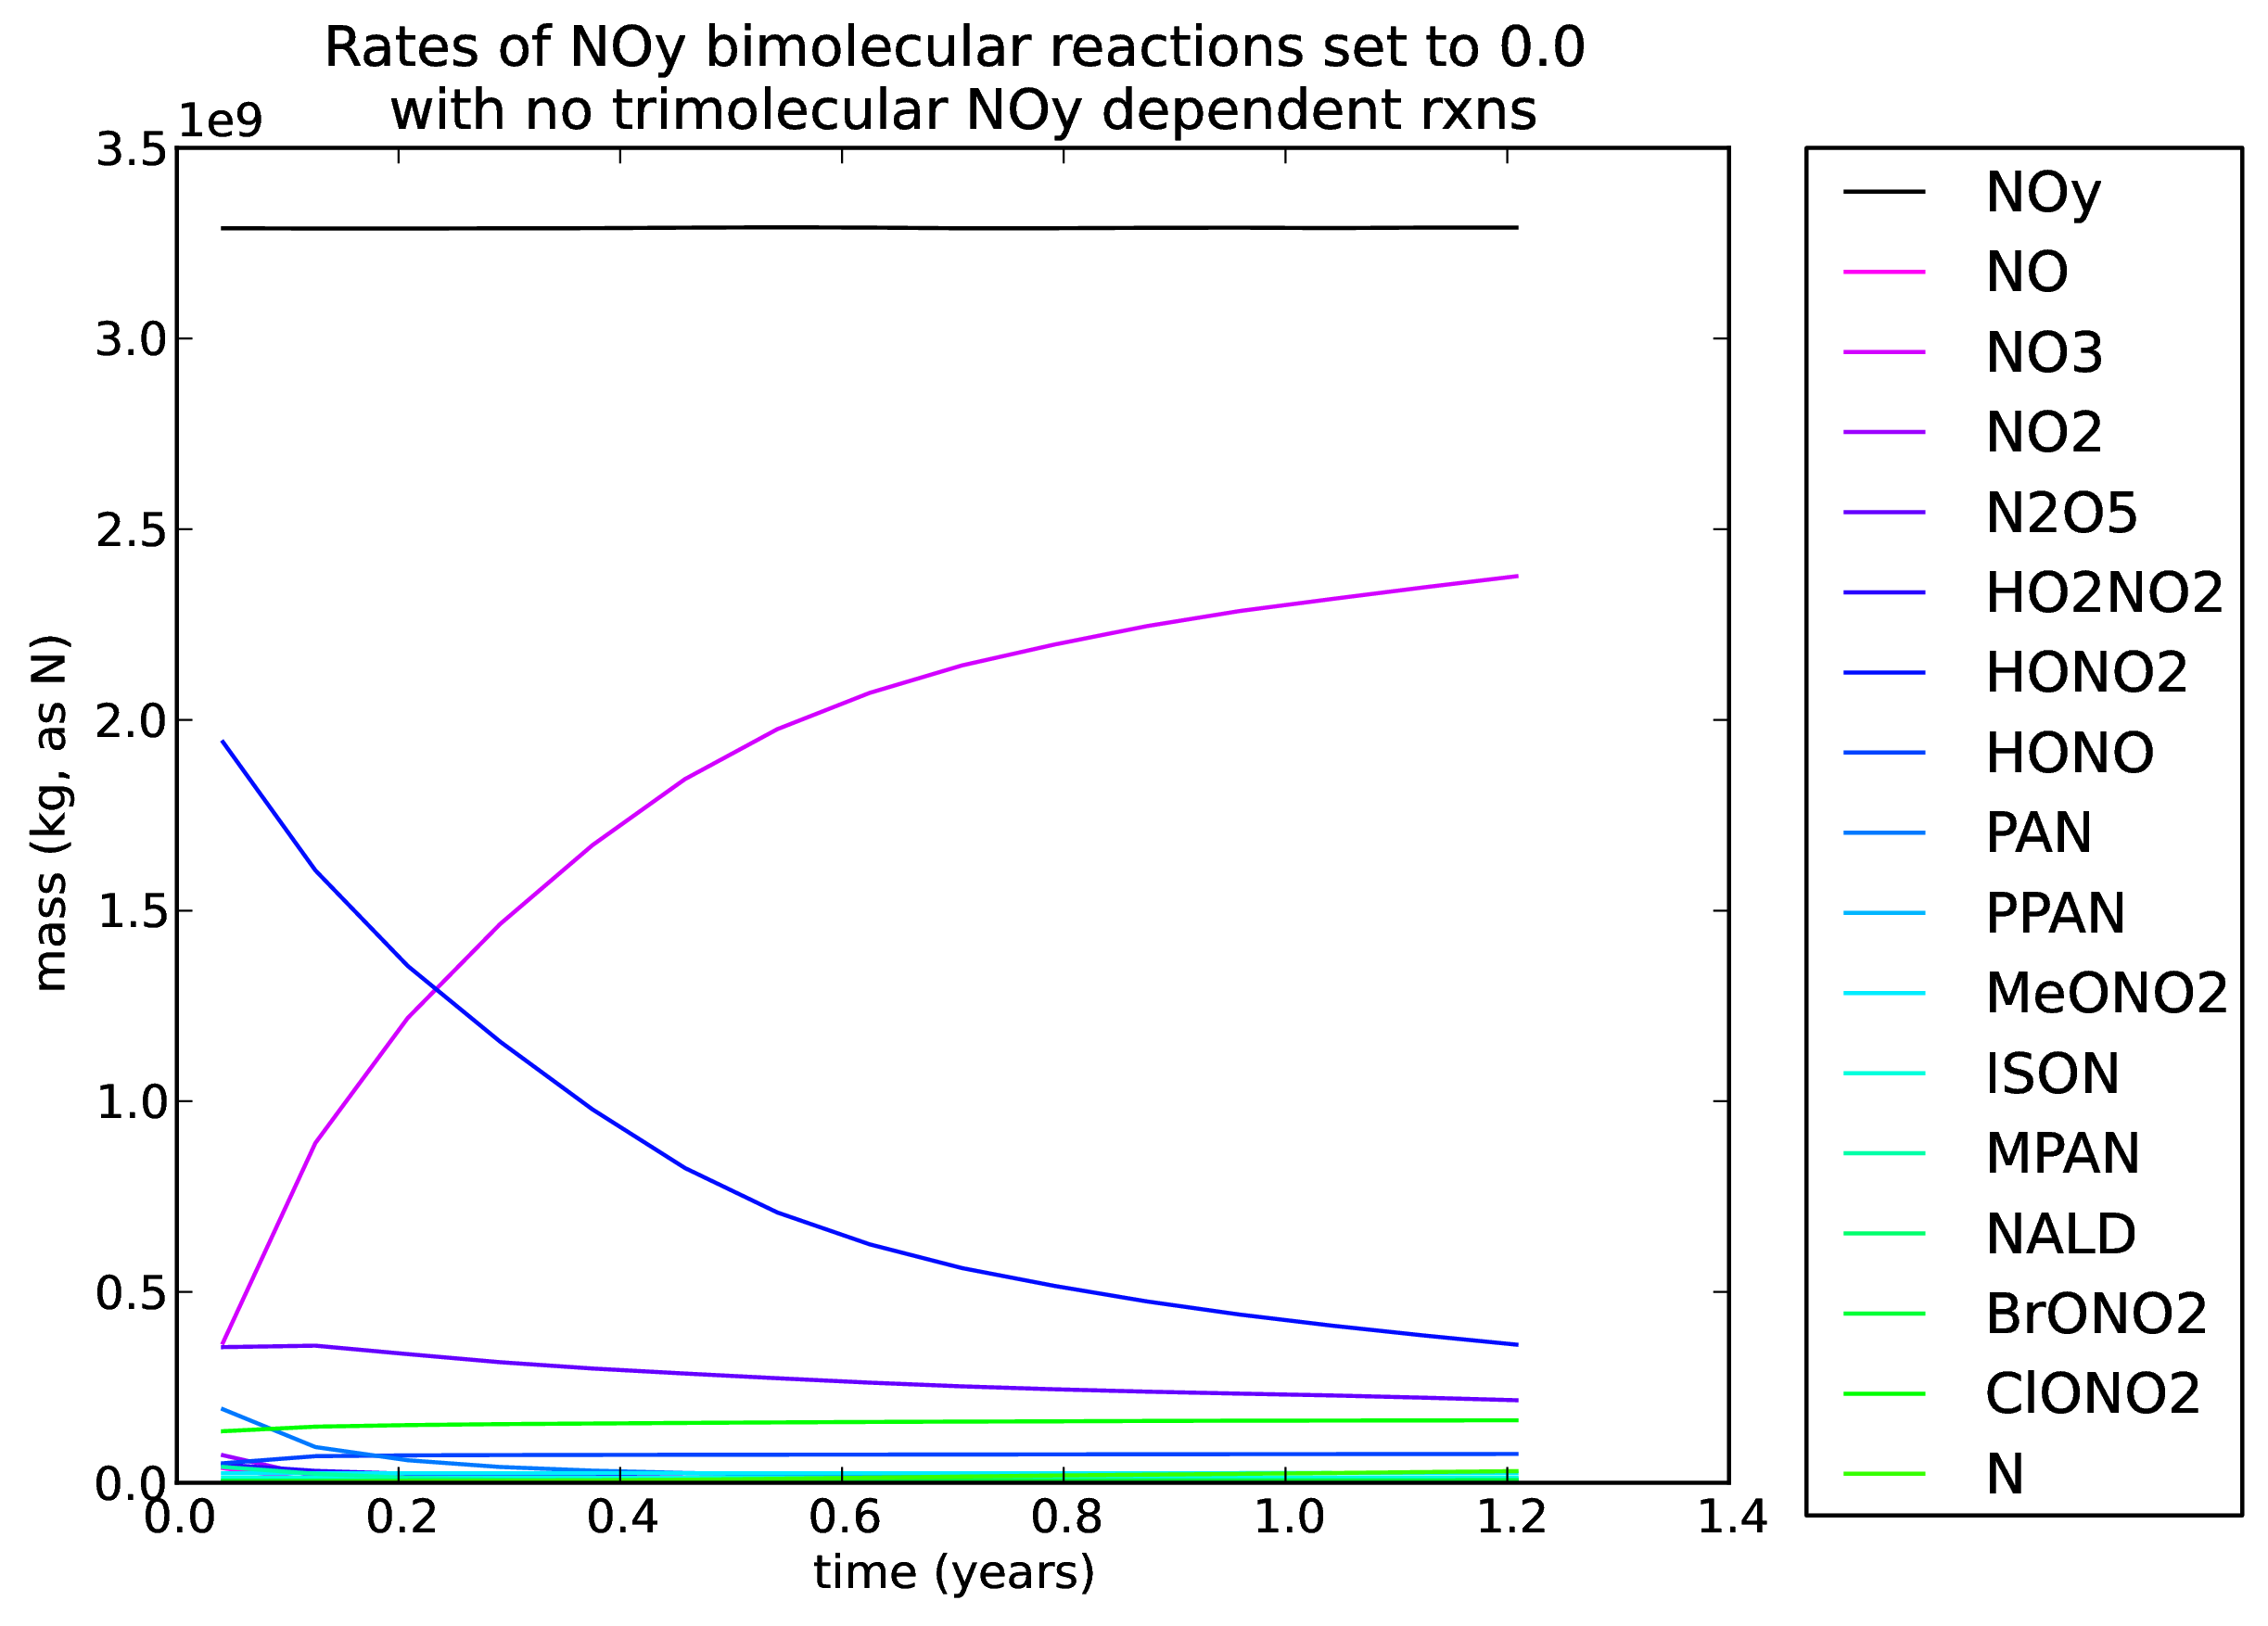
16. Rates of NOy bimolecular interconversion reactions were set to zero
A copy of xjciv was taken (including the doubled HNO3 initial condition). All NOy bimolecular interconversion reactions in ukca_chem_strattrop were set to zero (i.e. there were only termolecular reactions). This is job xlbqd.
All plots from this run can be found here: ![]() BimolZero_xlbqd.pdf
BimolZero_xlbqd.pdf ![]()
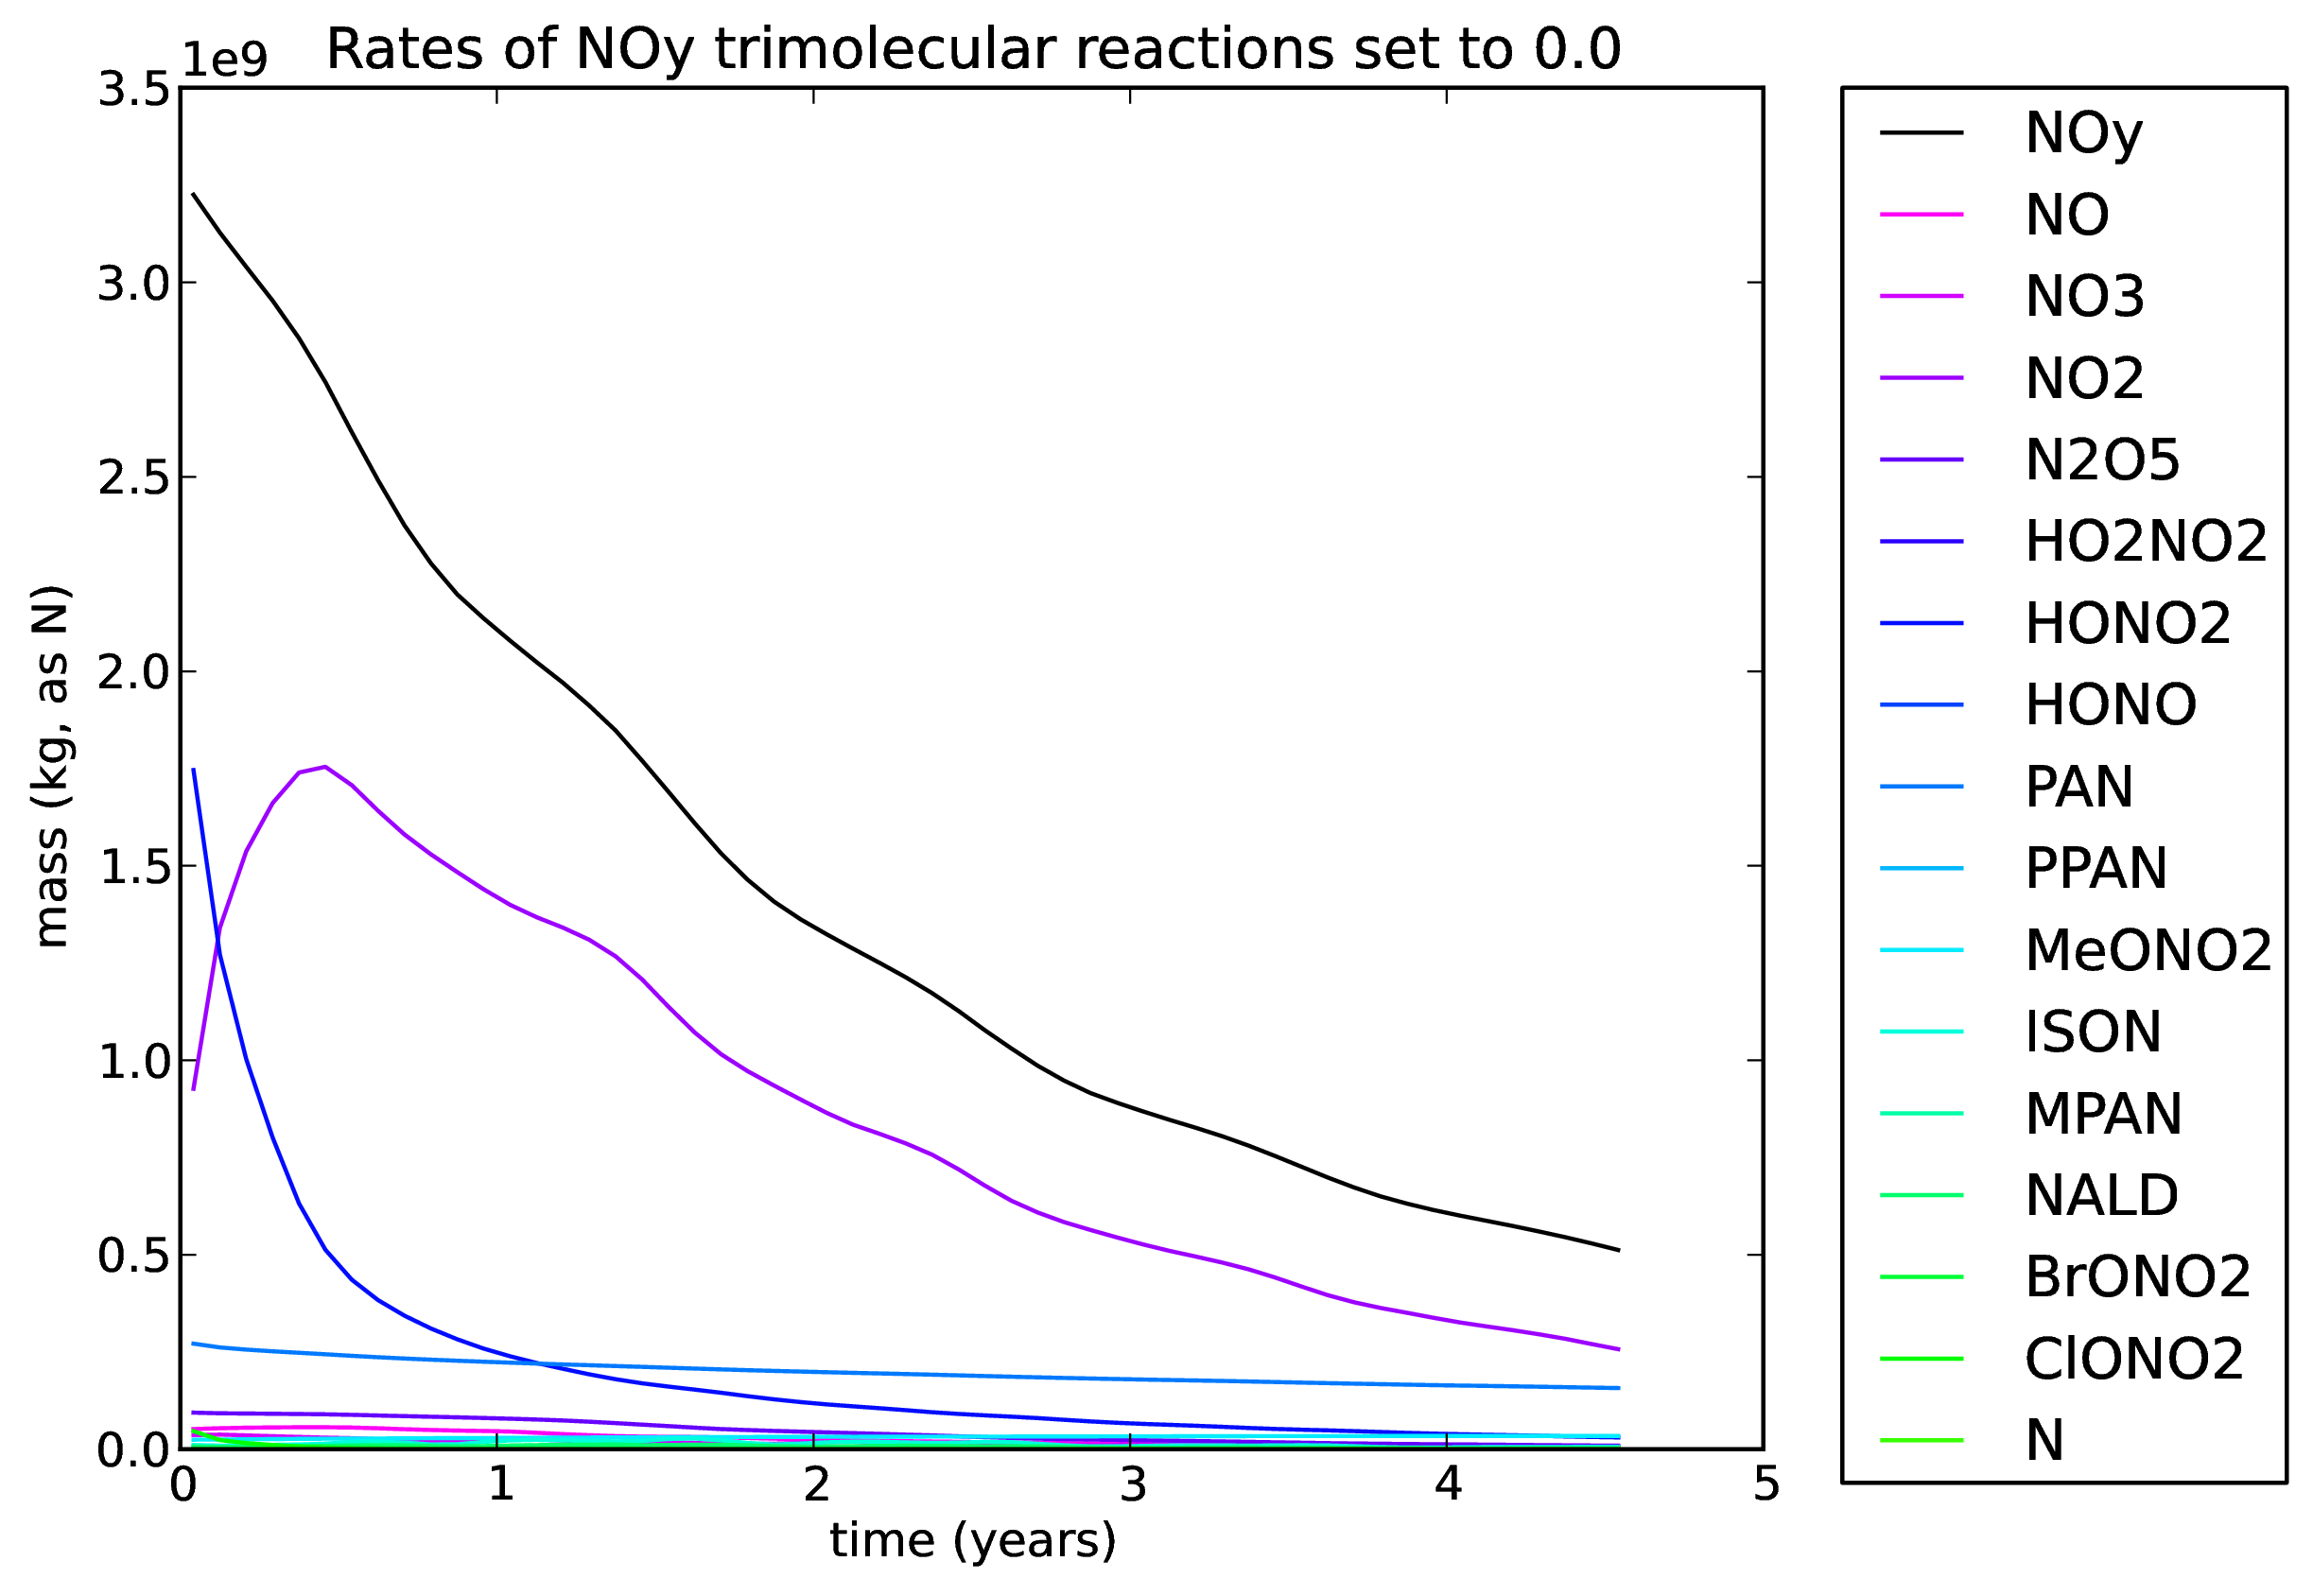
17. Rates of NOy bimolecular interconversion reactions were set to zero and the special reactions were removed
A copy of xjciv was taken (including the doubled HNO3 initial condition). All NOy bimolecular interconversion reactions in ukca_chem_strattrop were set to zero (i.e. there were only trimolecular reactions) and the special trimolecular reactions in asad_trimol were removed. This is job xlbqf.
All plots from this run can be found here: ![]() BimolZeroNoDep_xlbqf.pdf
BimolZeroNoDep_xlbqf.pdf ![]()
18. Rates of NOy trimolecular interconversion reactions were set to zero
A copy of xjciv was taken (including the doubled HNO3 initial condition). All NOy trimolecular interconversion reactions in ukca_chem_strattrop were set to zero (i.e. there were only bimolecular reactions). This is job xlbqc.
All plots from this run can be found here: ![]() TrimolZero_xlbqc.pdf
TrimolZero_xlbqc.pdf ![]()
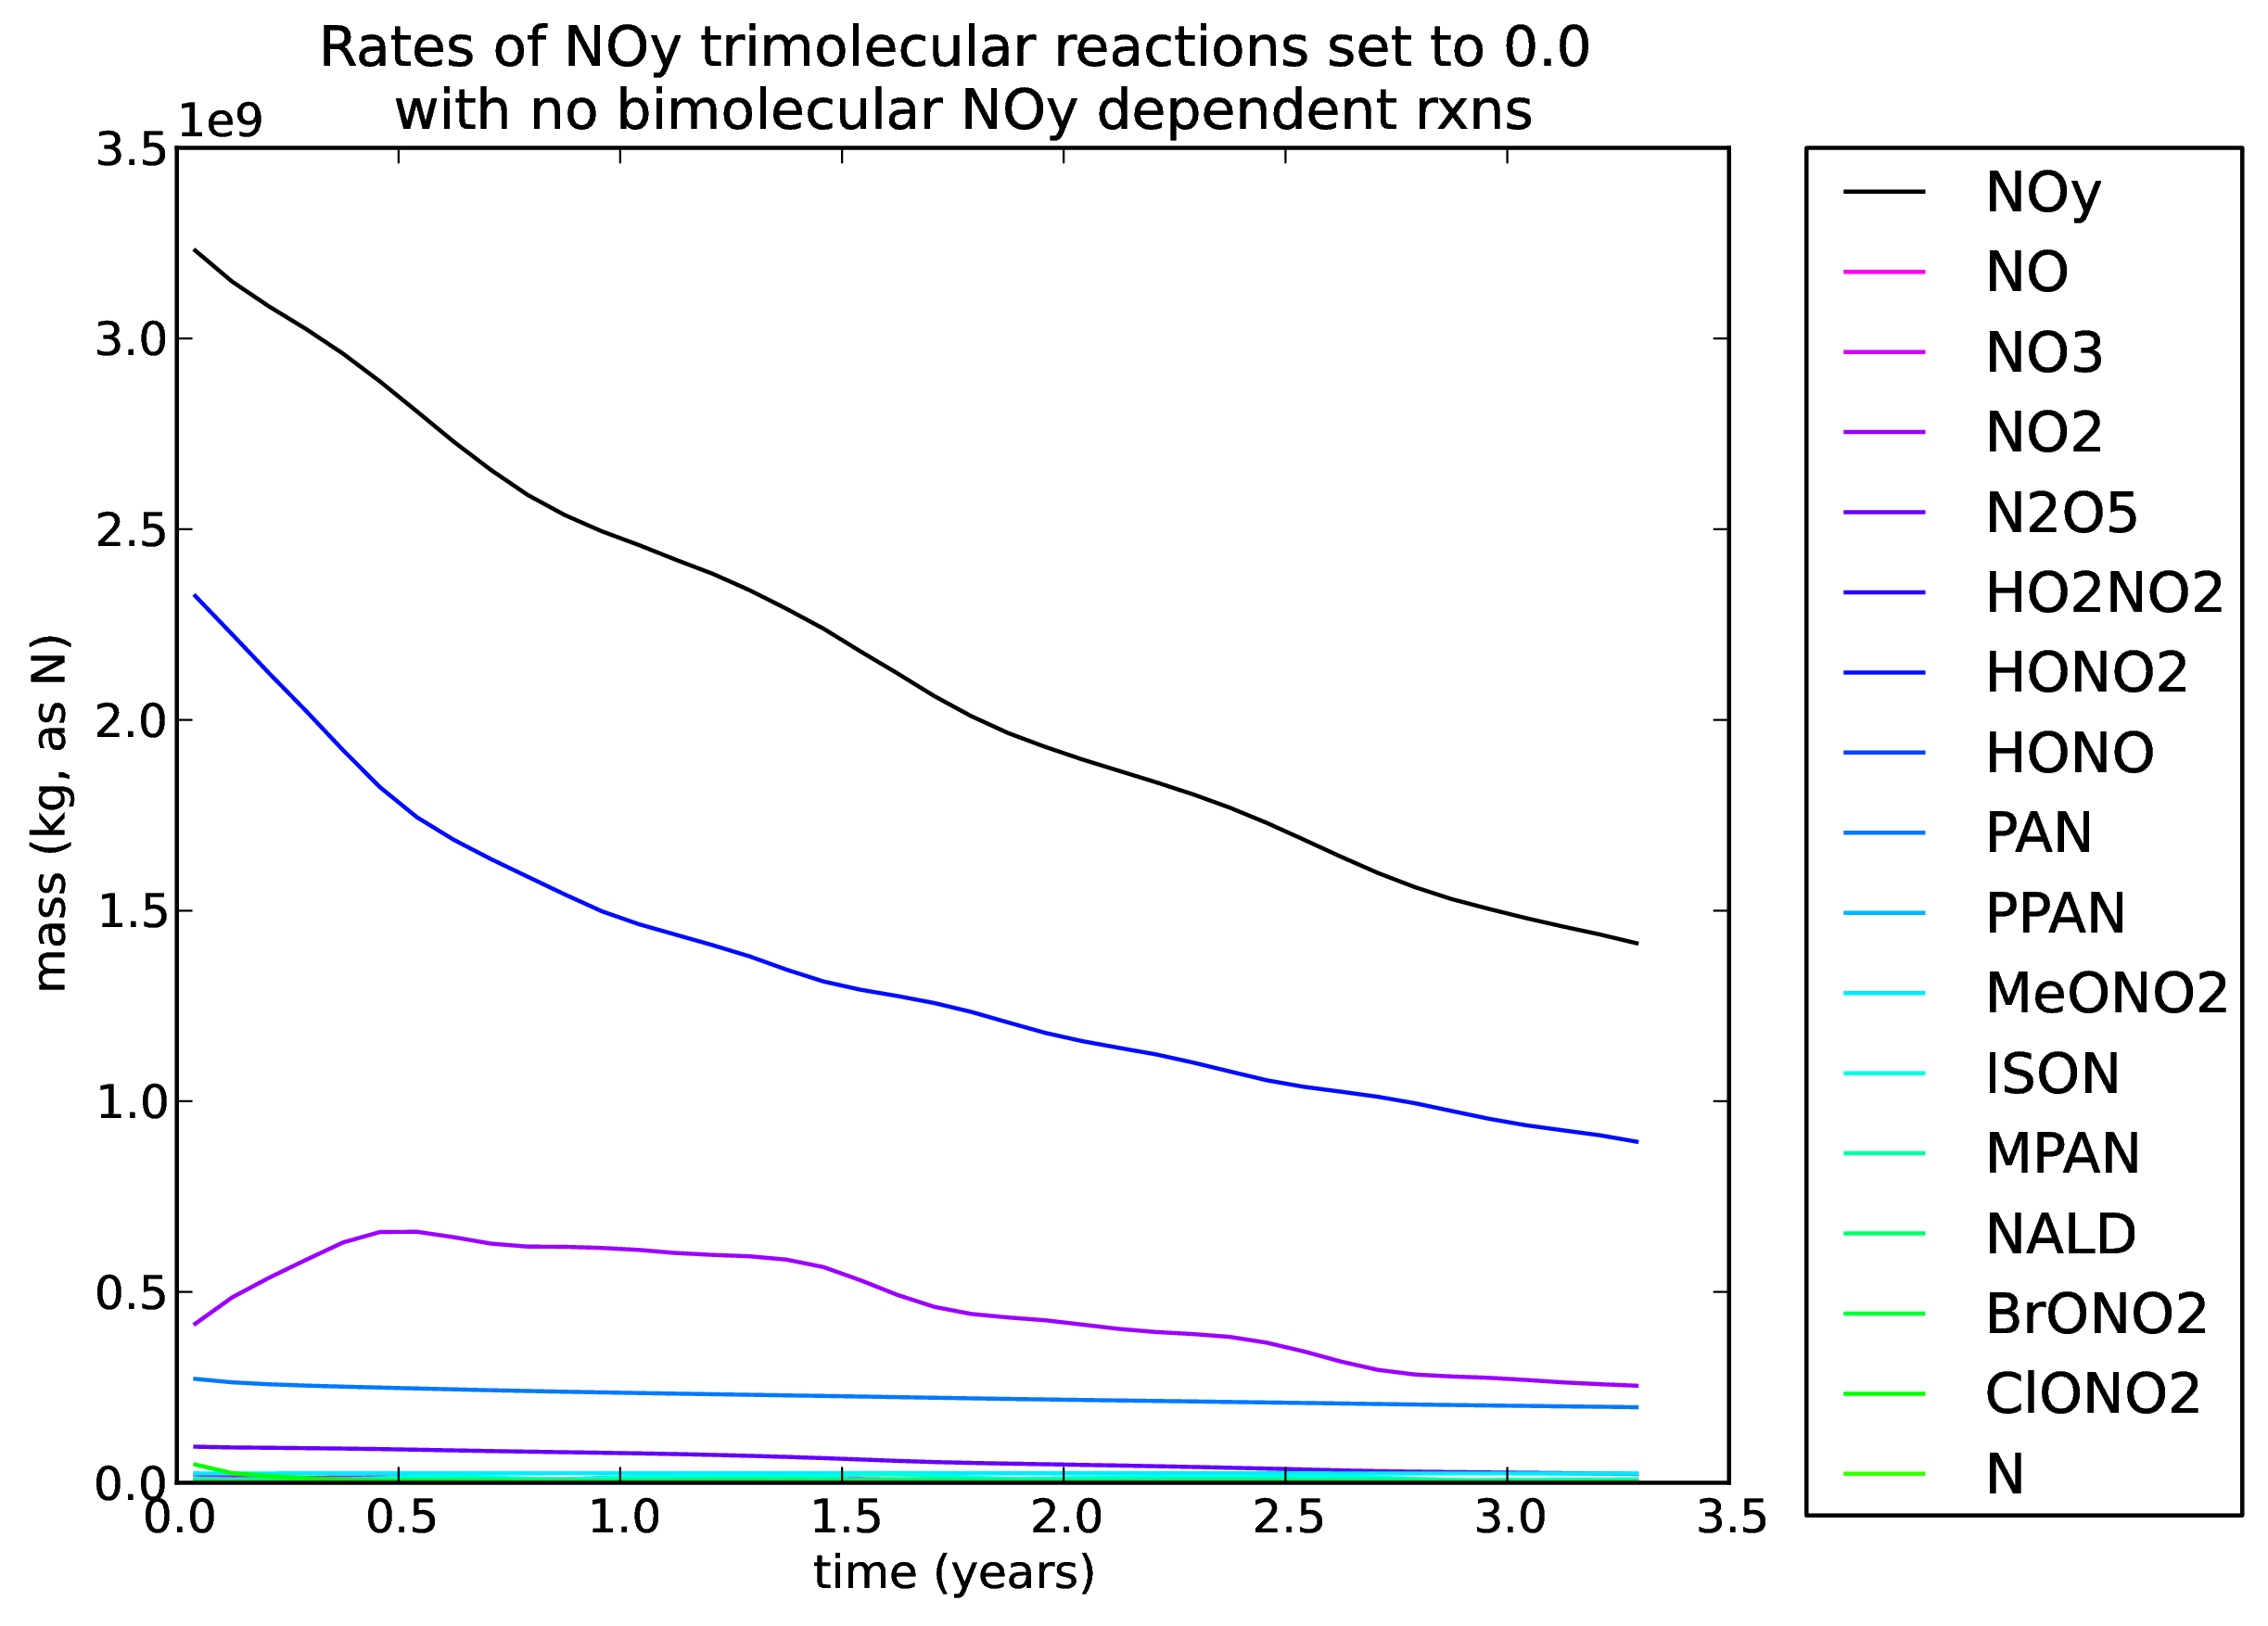
19. Rates of NOy trimolecular interconversion reactions were set to zero and the NOy special reactions were removed
A copy of xjciv was taken (including the doubled HNO3 initial condition). All NOy trimolecular interconversion reactions in ukca_chem_strattrop were set to zero (i.e. there were only bimolecular reactions) and the special bimolecular reactions in asad_bimol were removed. This is job xlbqe.
All plots from this run can be found here: ![]() TrimolZeroNoDep_xlbqe.pdf
TrimolZeroNoDep_xlbqe.pdf ![]()
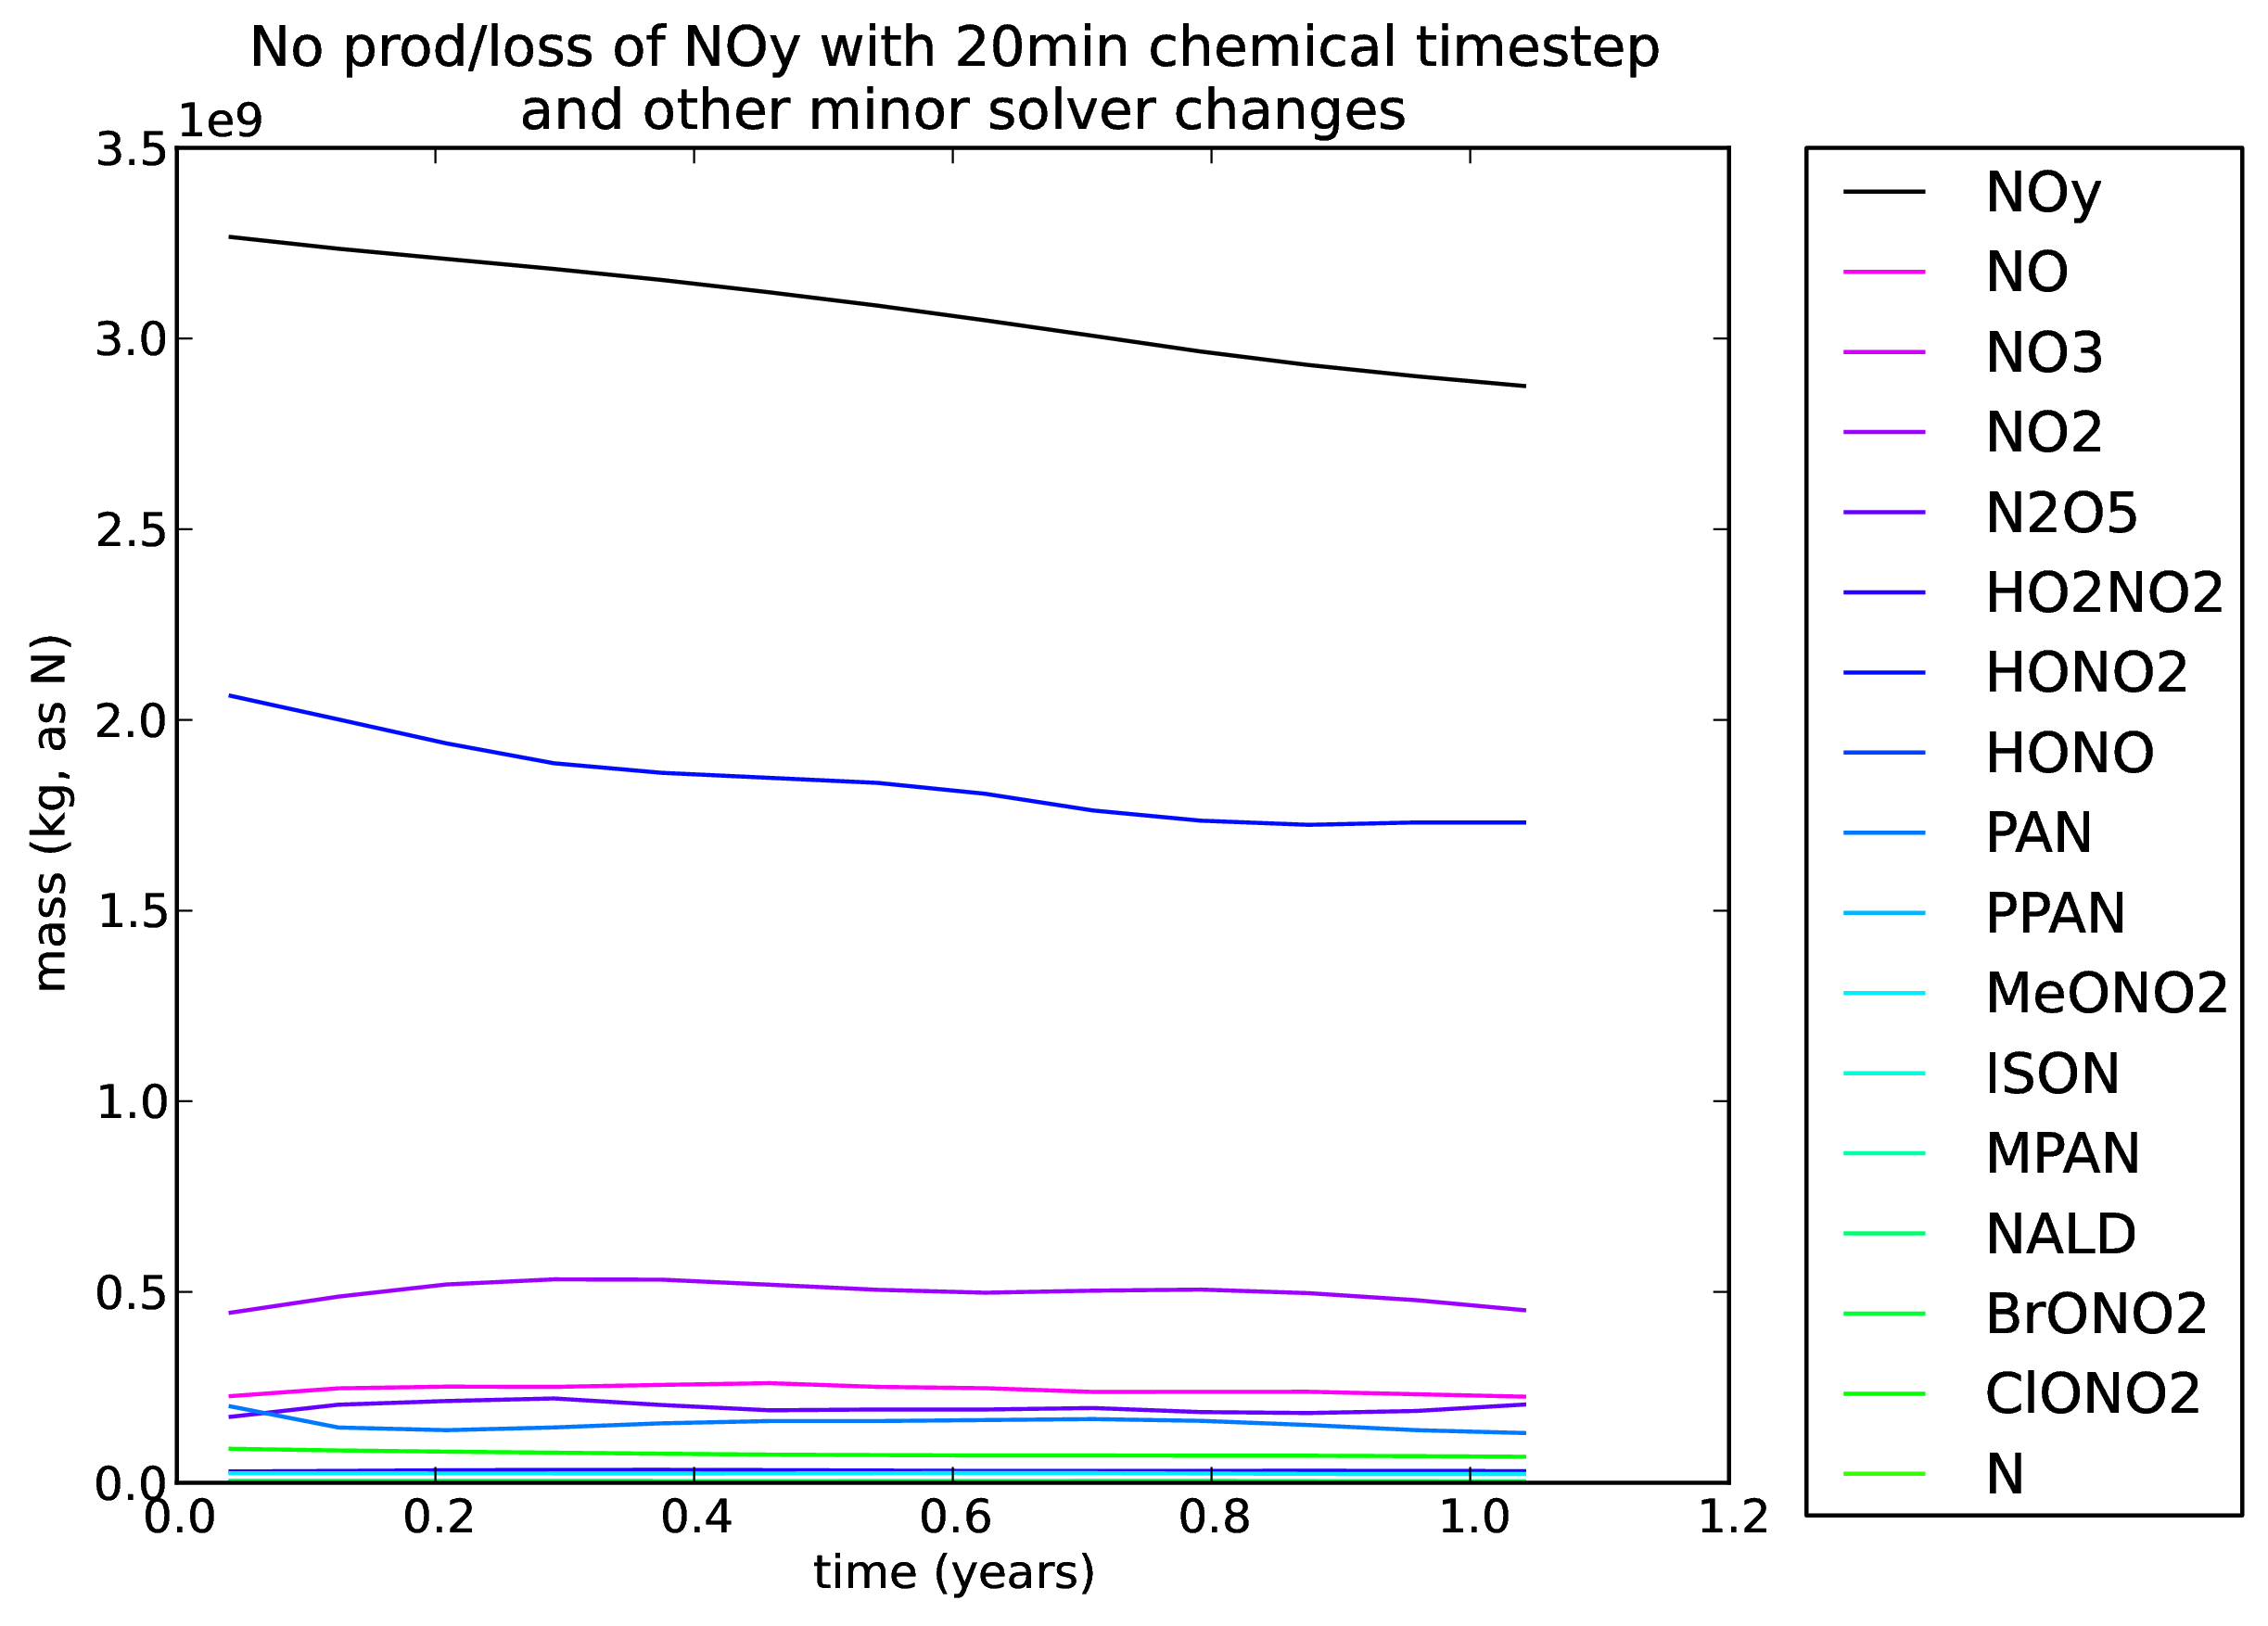
20. Solver and timestep changes
A copy of xjciv was taken (including the doubled HNO3 initial condition). The chemical timestep was changed to 20 minutes (rather than 1 hour), the value of rafeps was made smaller and maxneg was set to zero. This is job xlbqg.
All plots from this run can be found here: ![]() SolverChanges_xlbqg.pdf
SolverChanges_xlbqg.pdf ![]()
Further xjciv analysis
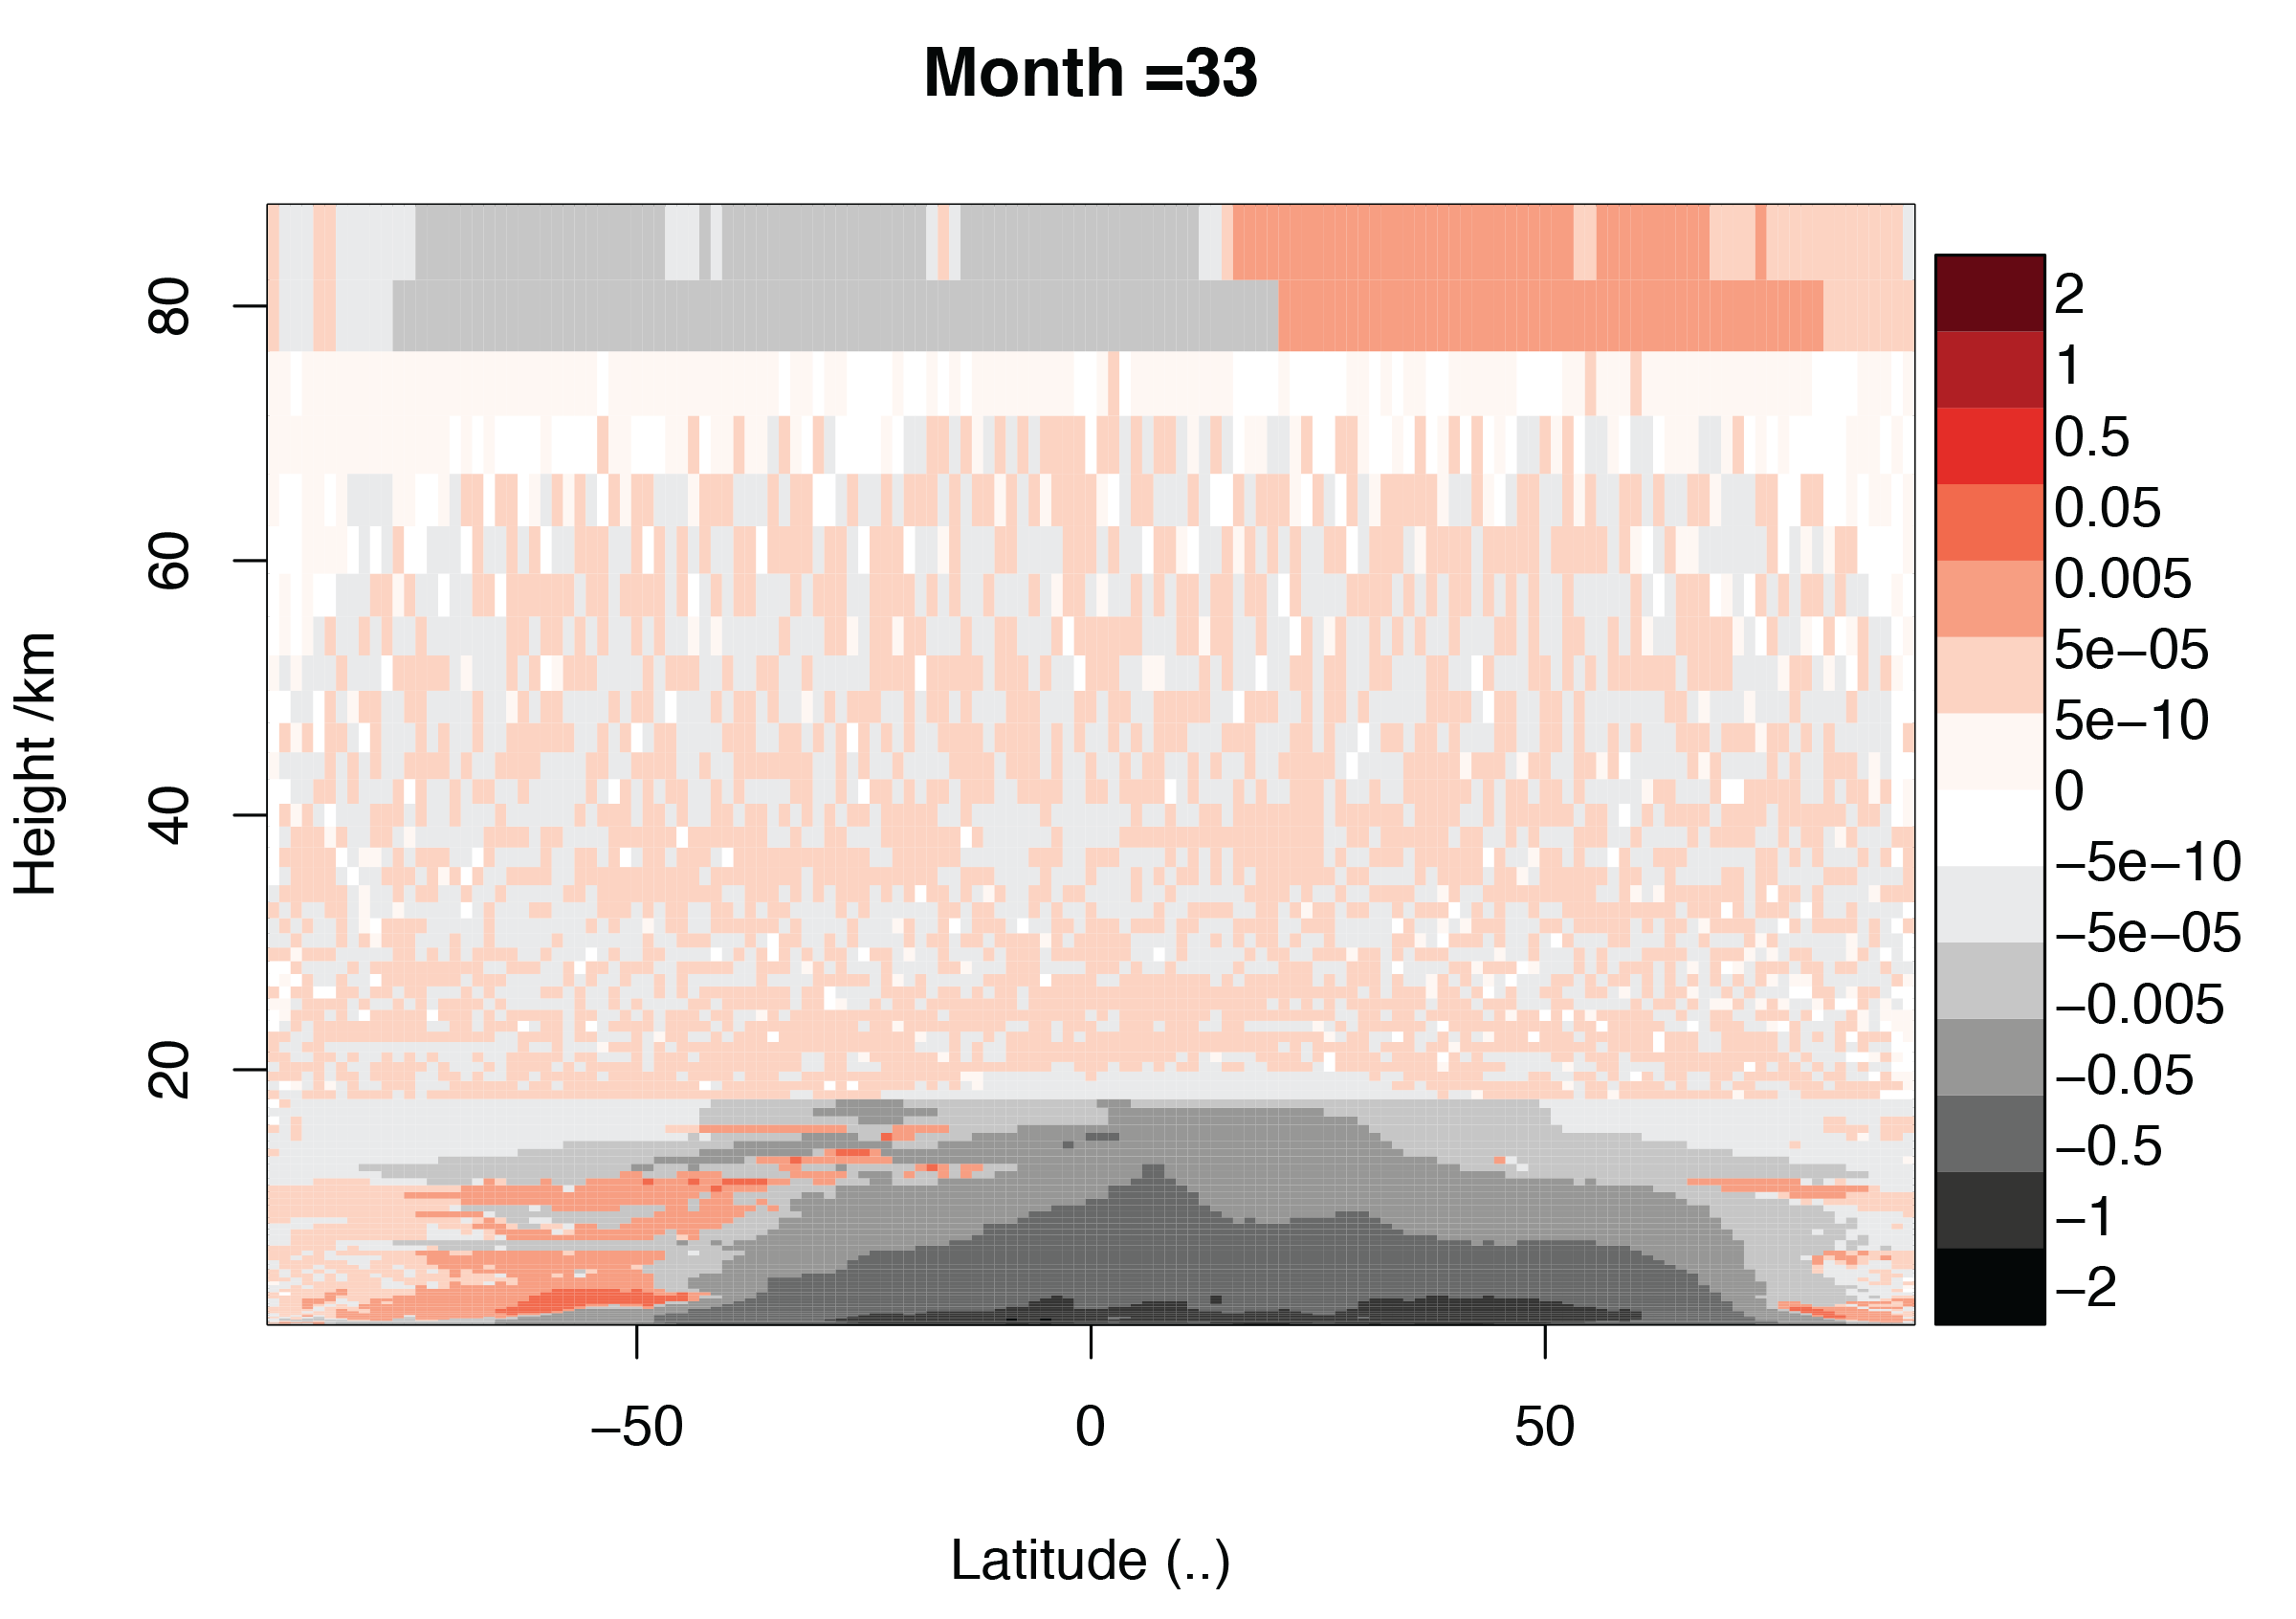
ATA has performed further analysis on the xjciv simulation (where the production and loss of NOy was removed) looking at the zonal-mean loss rate of NOy. The results are very interesting:
These point to a tropospheric loss, possibly associated with aerosol?
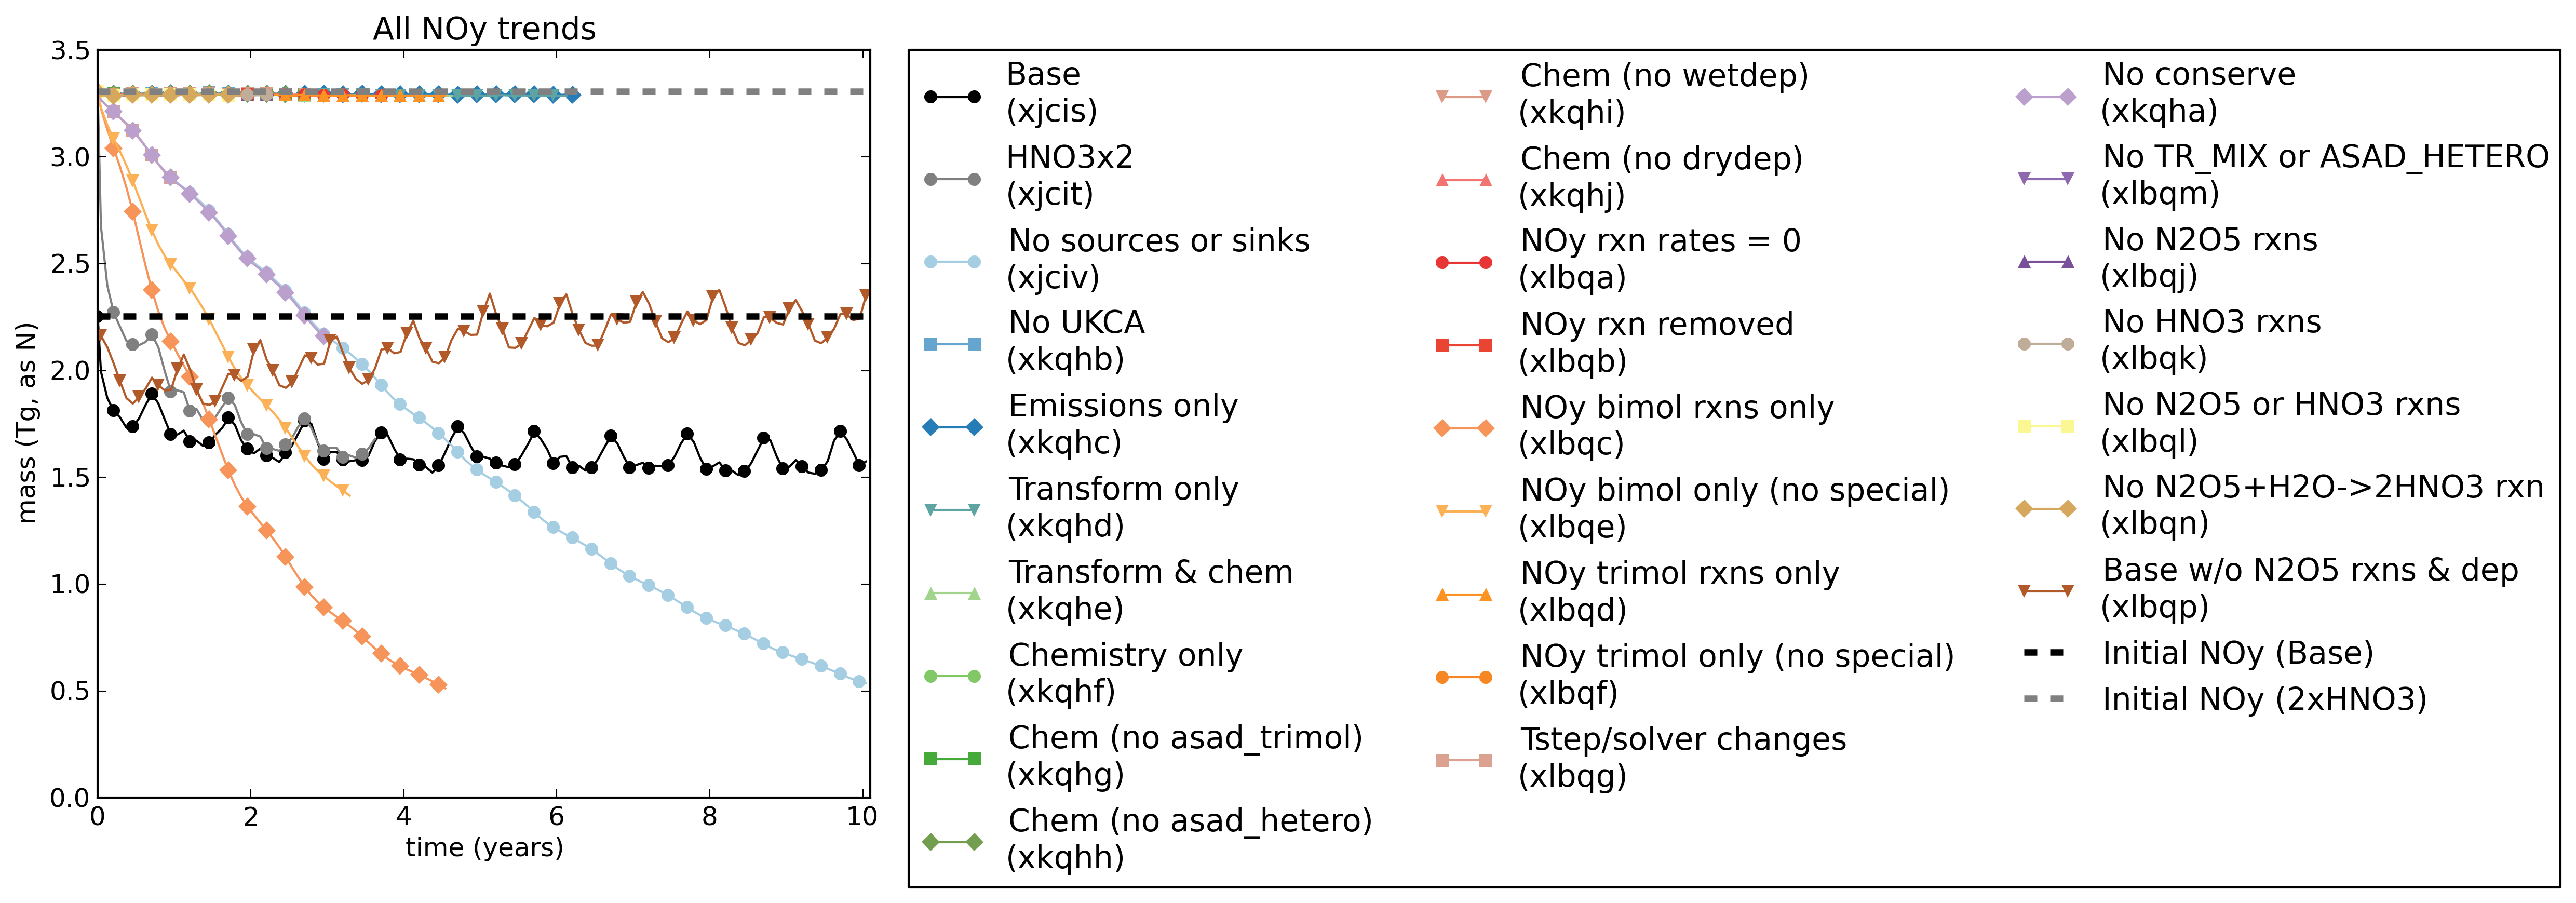
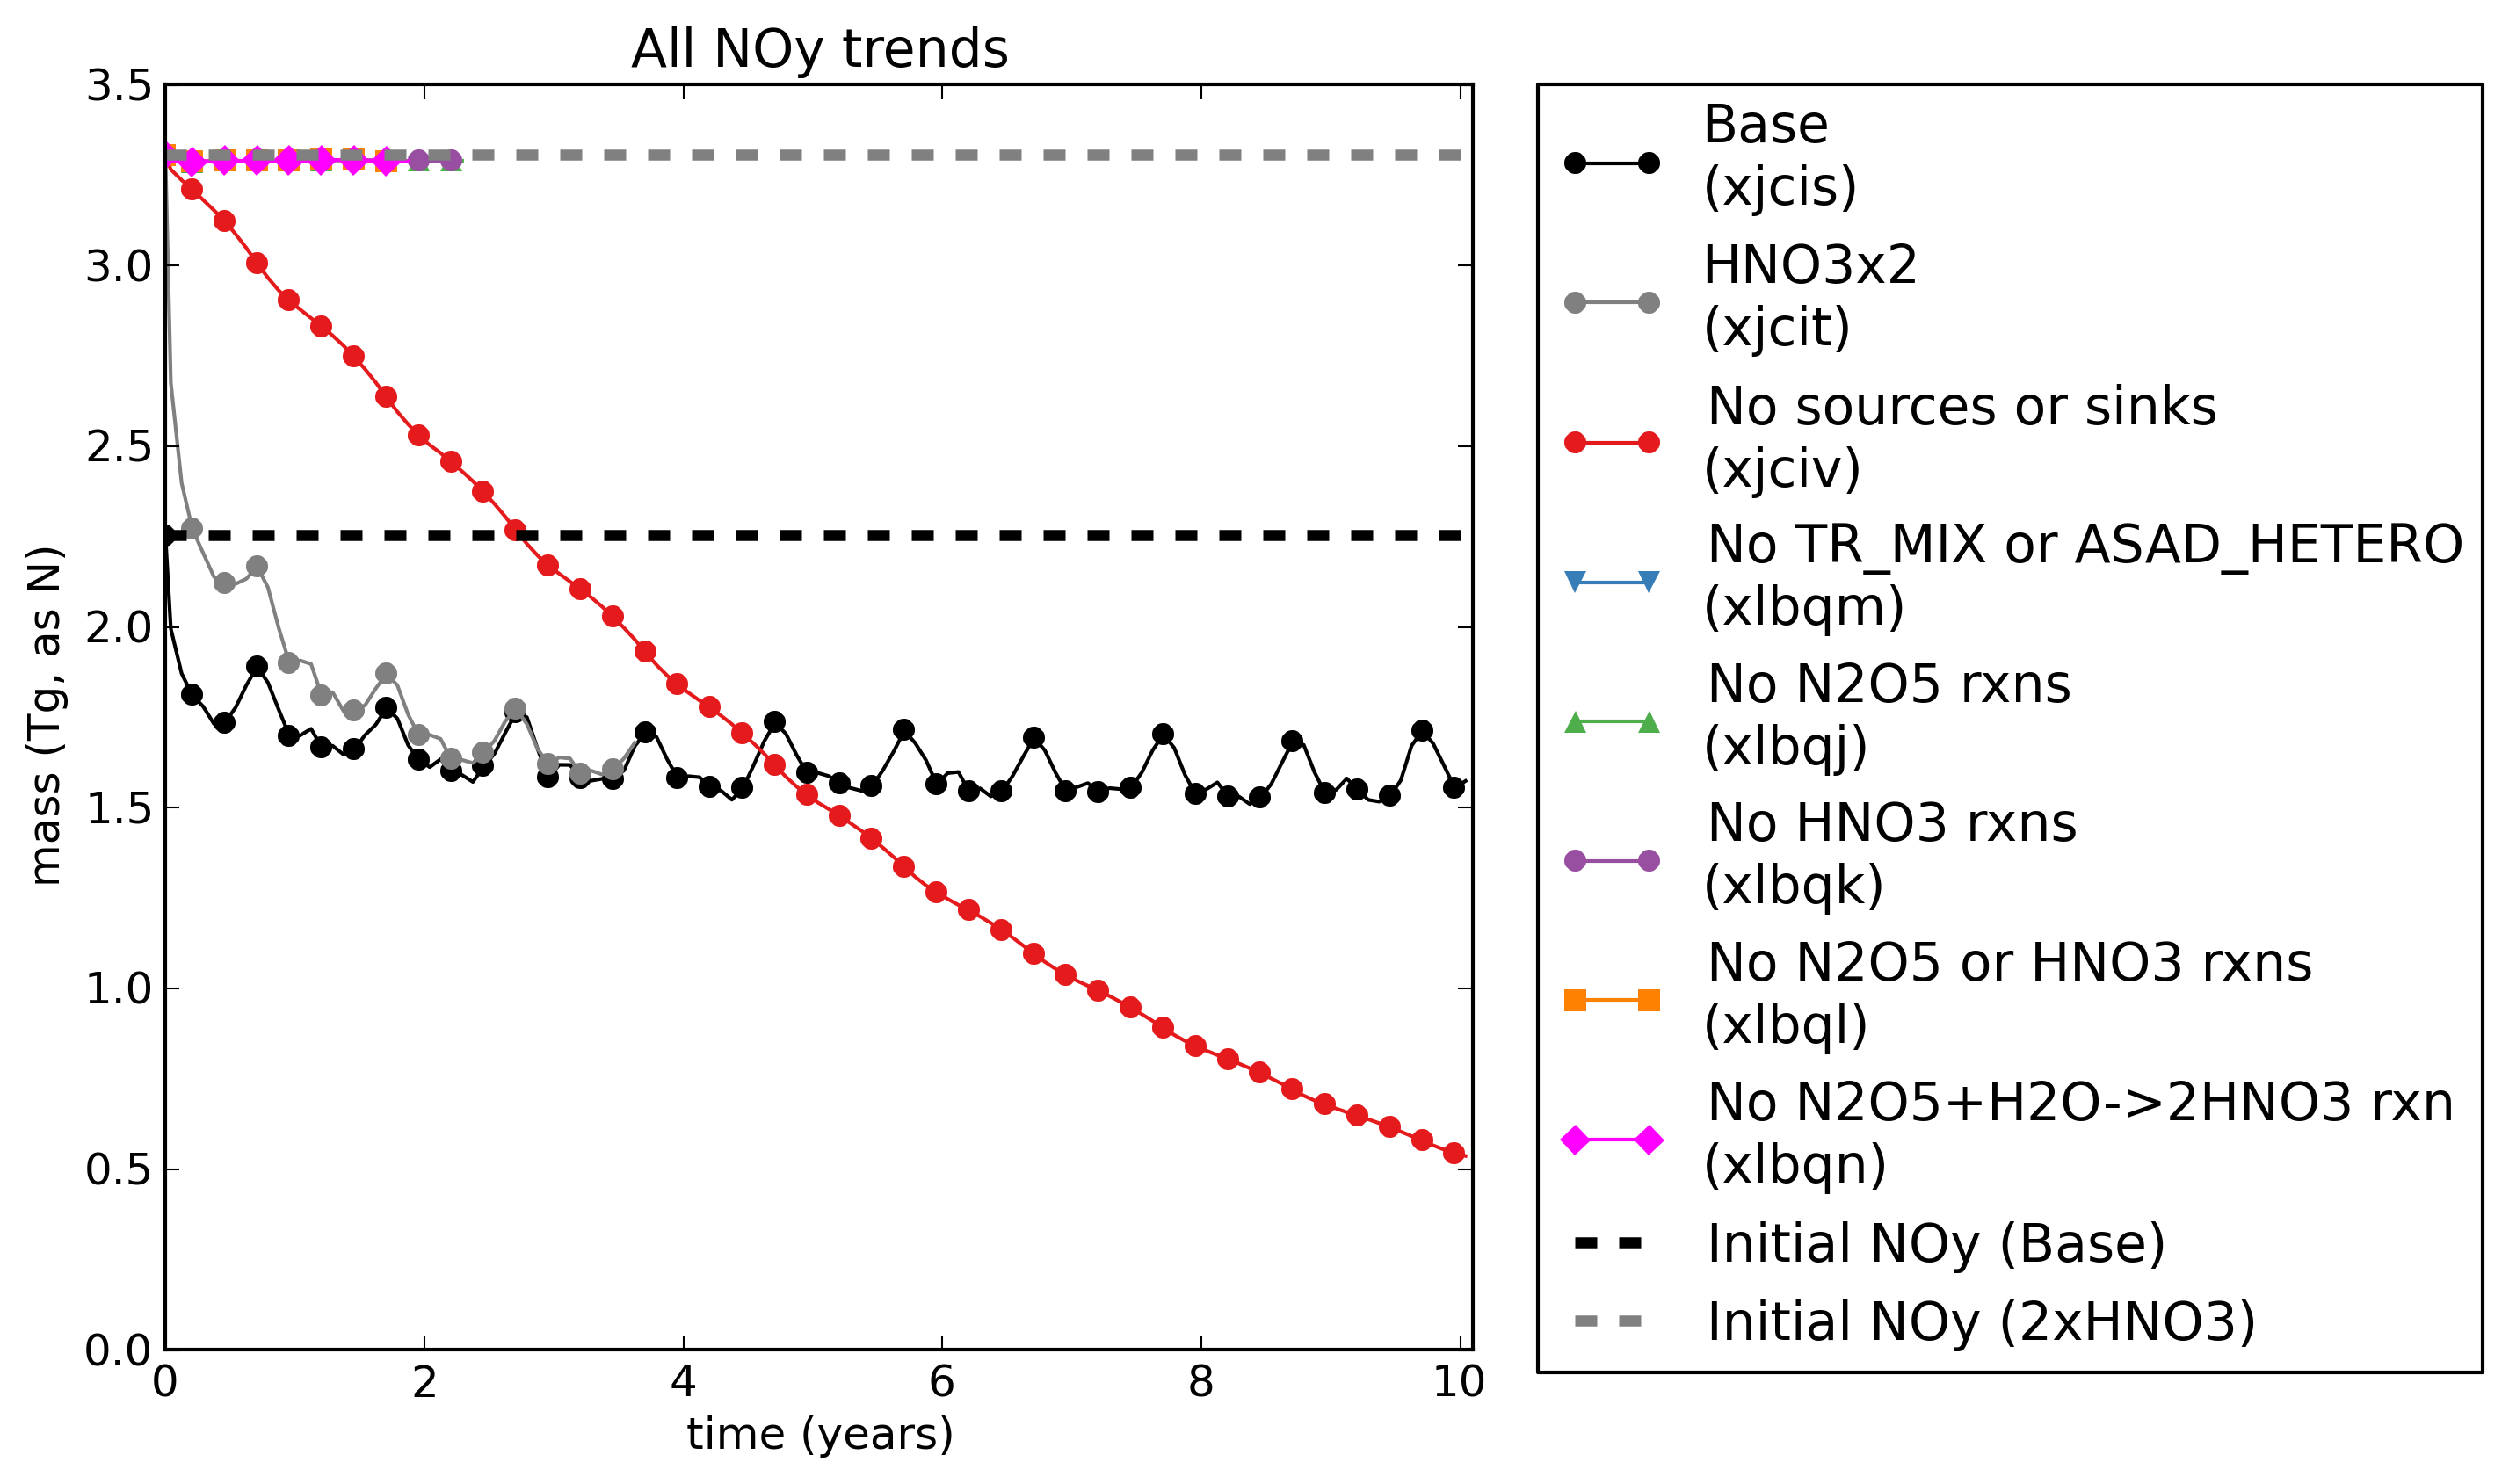
Summary of runs to date
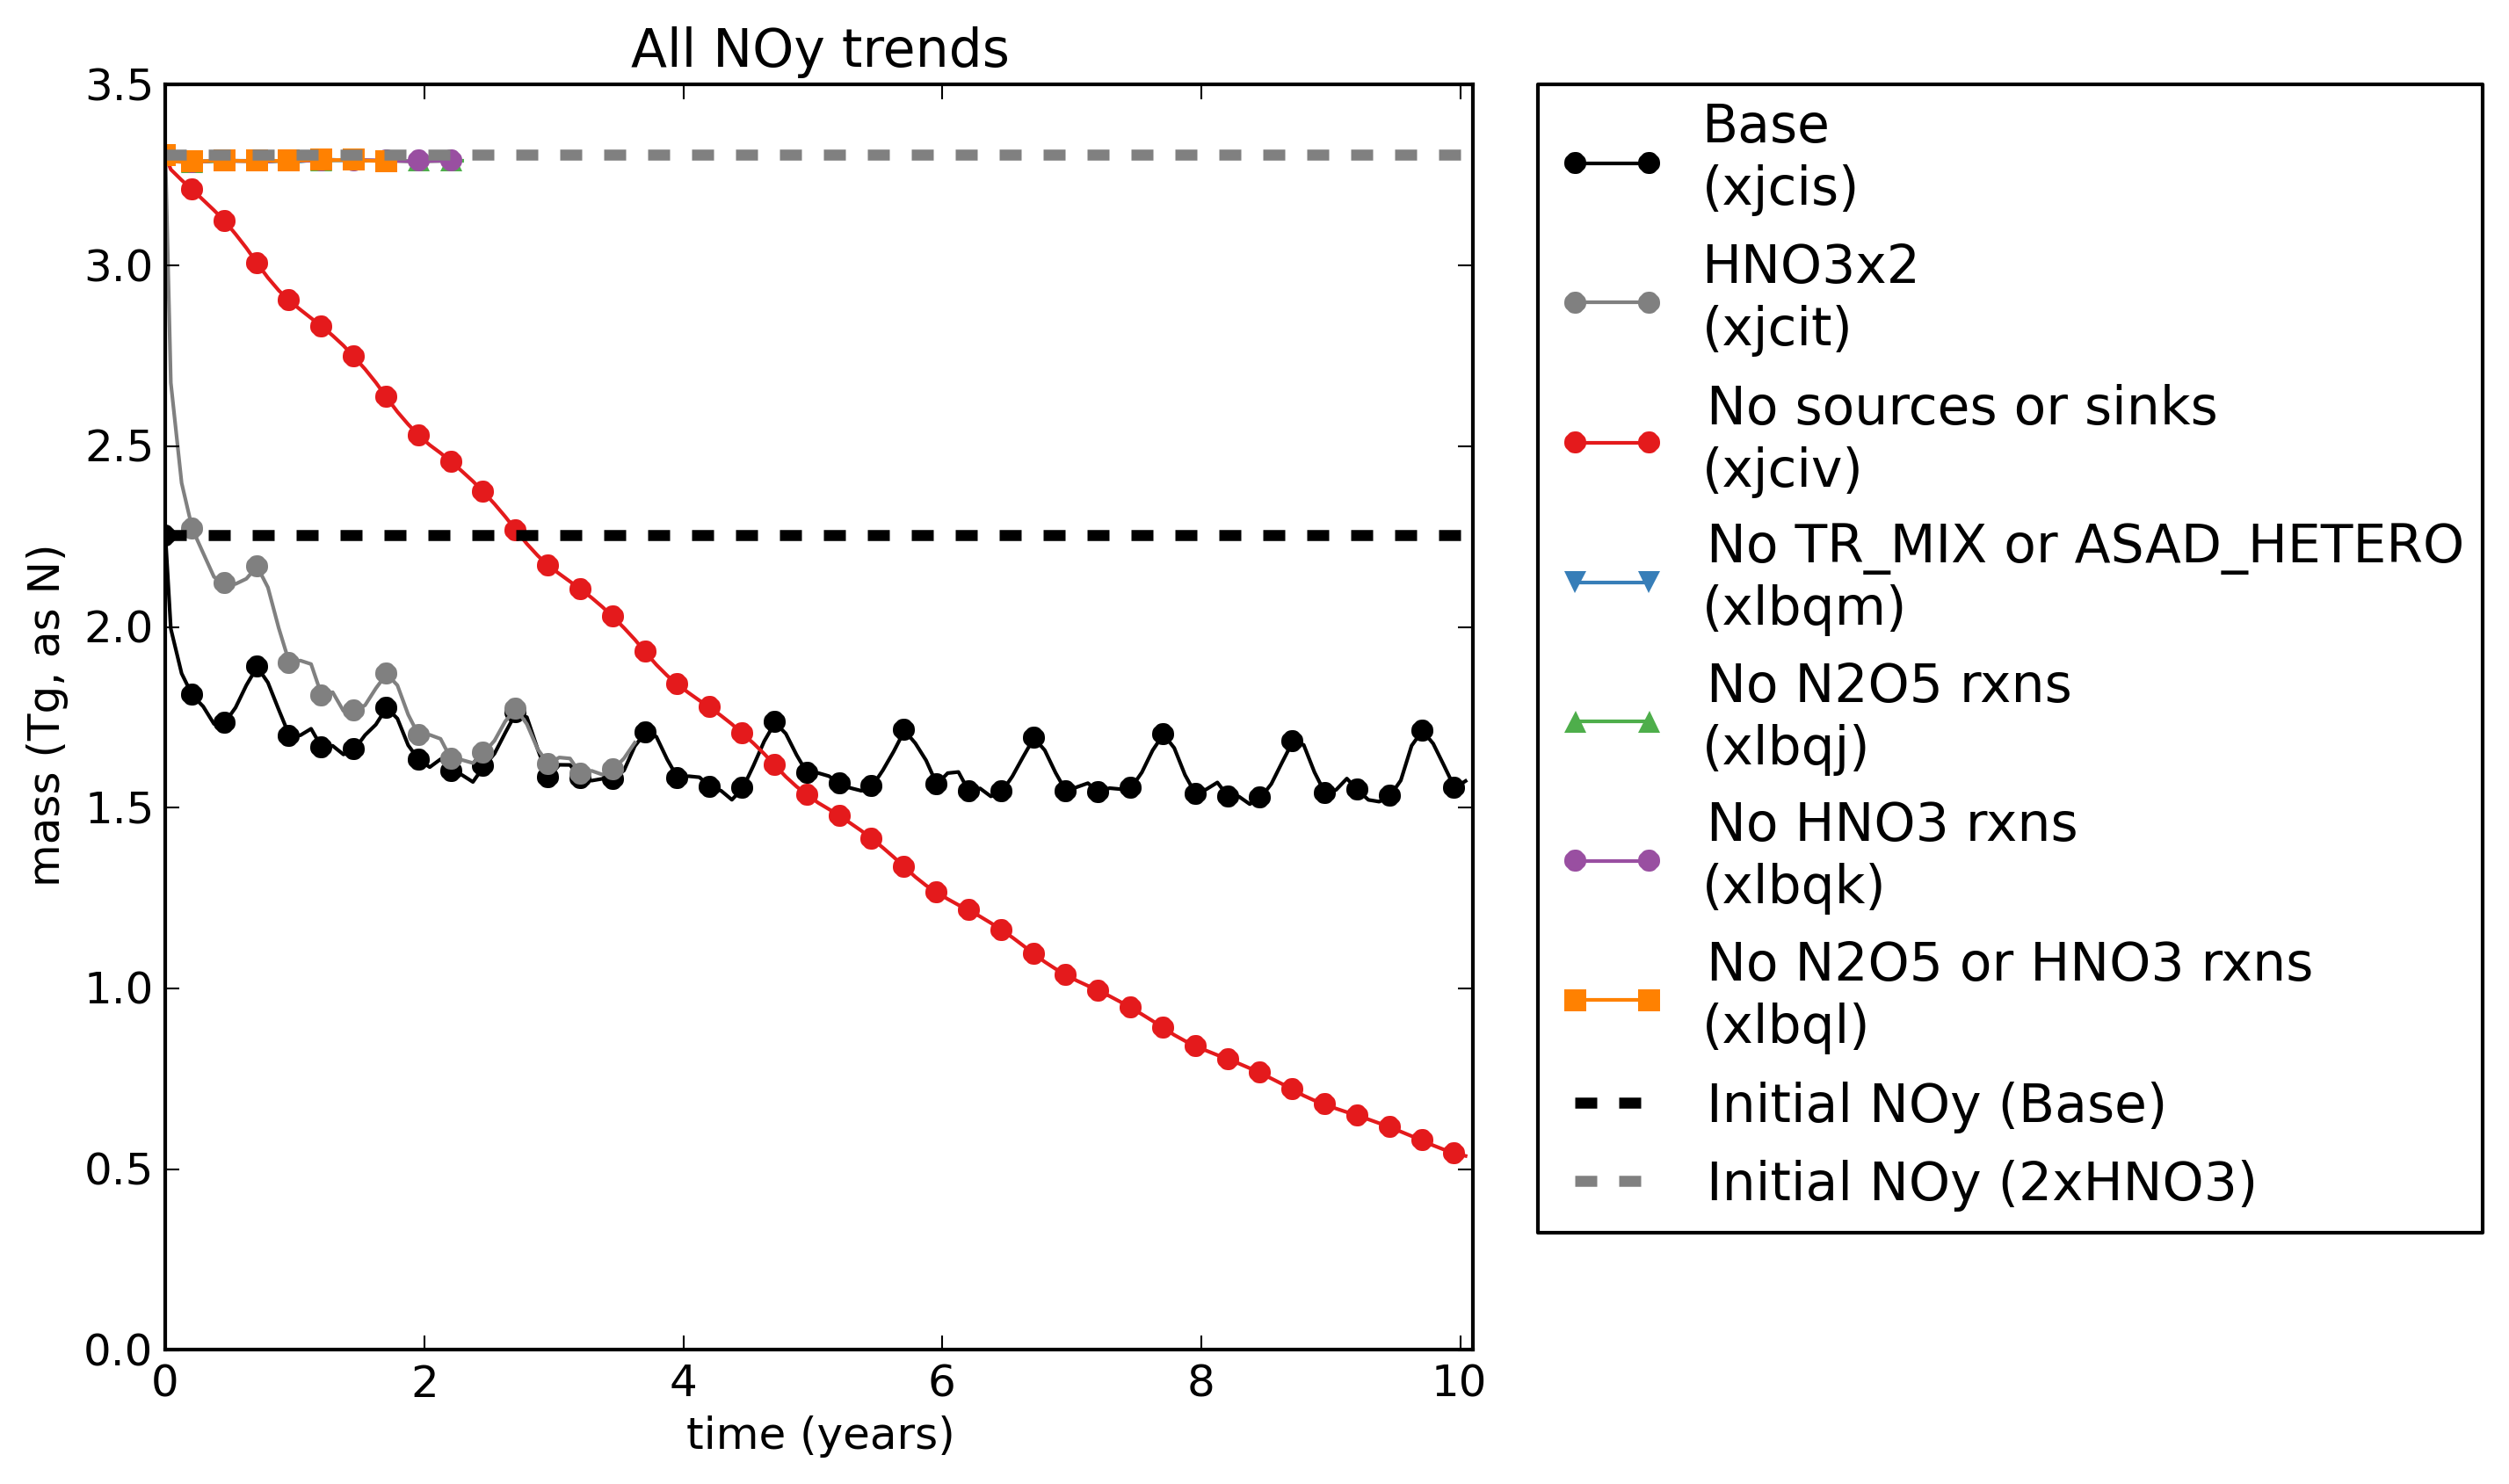
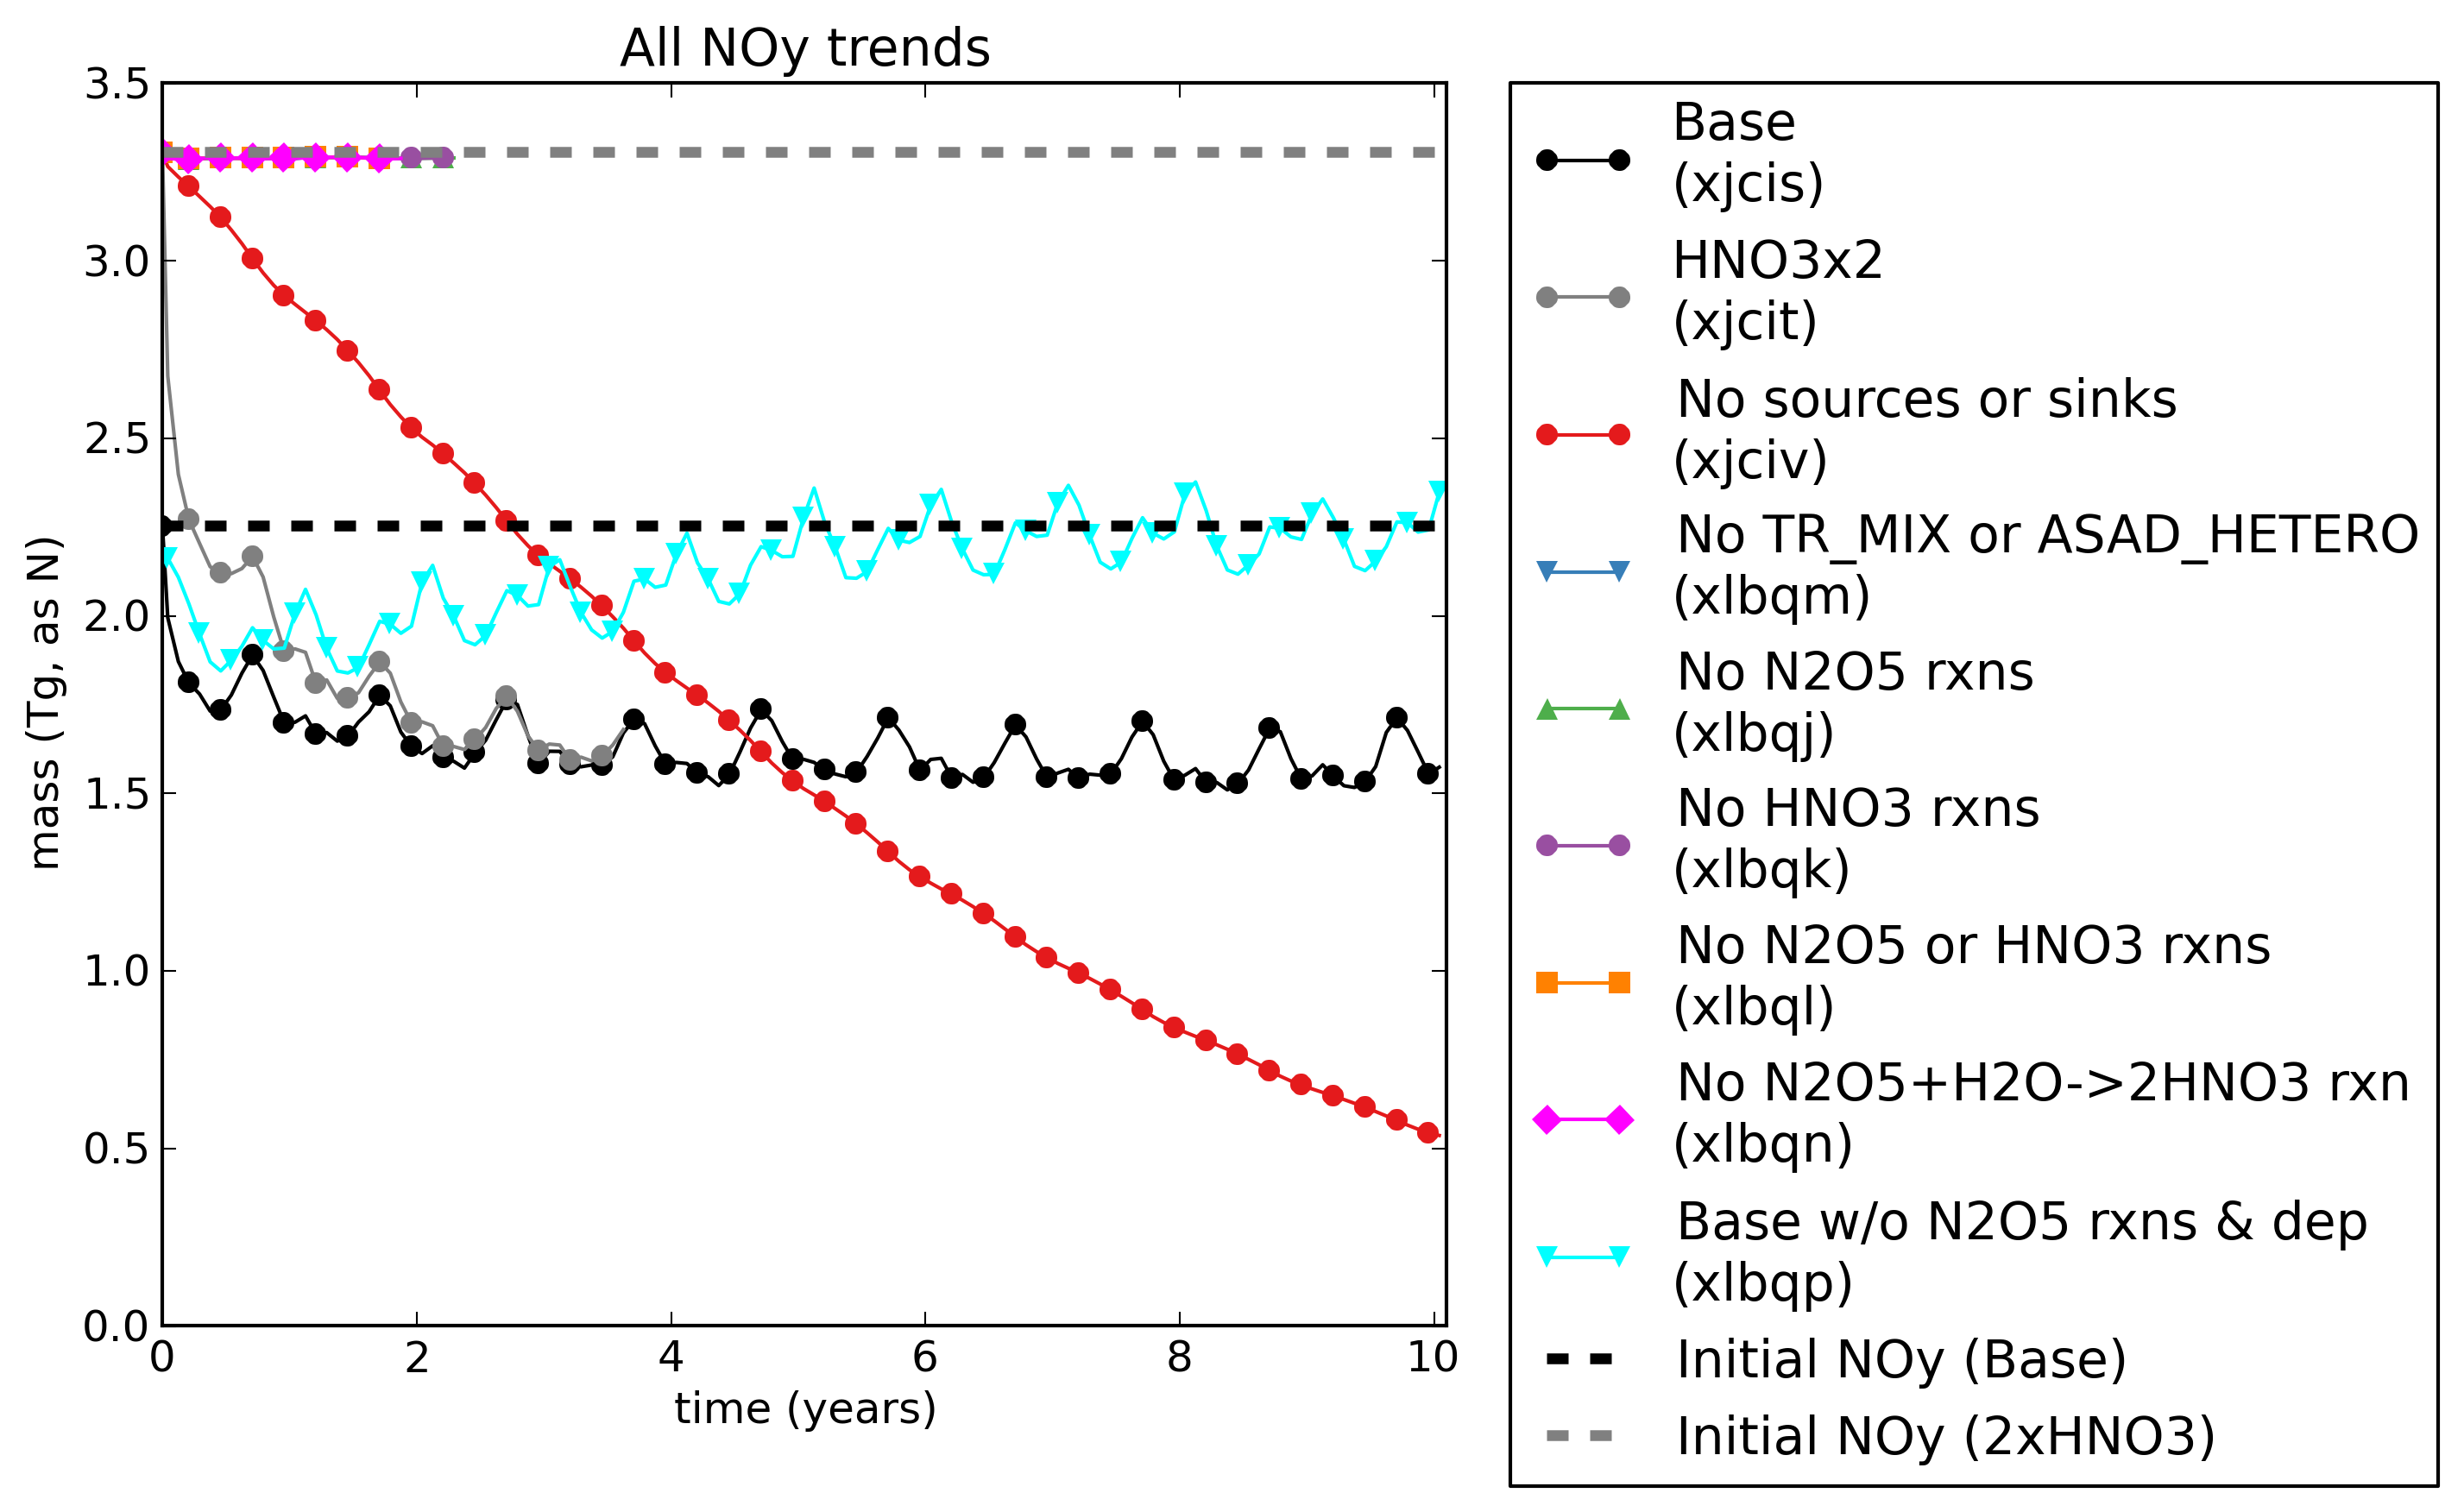
The following plot gives a summary of the runs to date, with the initial value of NOy also included.
Tests planned
Following the teleconference on 2015-03-03, the following further tests/analysis were suggested:
Present: Luke Abraham (LA), Alex Archibald (AA), John Pyle (JP), Paul Griffiths (PG), James Keeble (JK), Martyn Chipperfield (MC), Sandip Dhomse (SD), Fiona O'Connor (FOC).
- Make sure asad_hetero is not called
- Check for any processes at 19km - extremely useful given the fact that the losses seem to occur below this height
- Do the zonal-mean diagnostics again for expt 15.
- Check the N2O5+M reaction in asad_trimol
- Either Build up NOy complexity from the ground up or try removing various NOy species (and associated reactions) from the solver instead
- it was decided to do 3 runs:
- remove N2O5
- remove HONO2
- remove both N2O5 and HONO2
- it was decided to do 3 runs:
- SD may be able to look at Zonal mean plots
- LA to set up a doodle poll for Mon 23rd/Tue 24th - done: http://doodle.com/zc2zguhgitatd7az
Role of TR_MIX
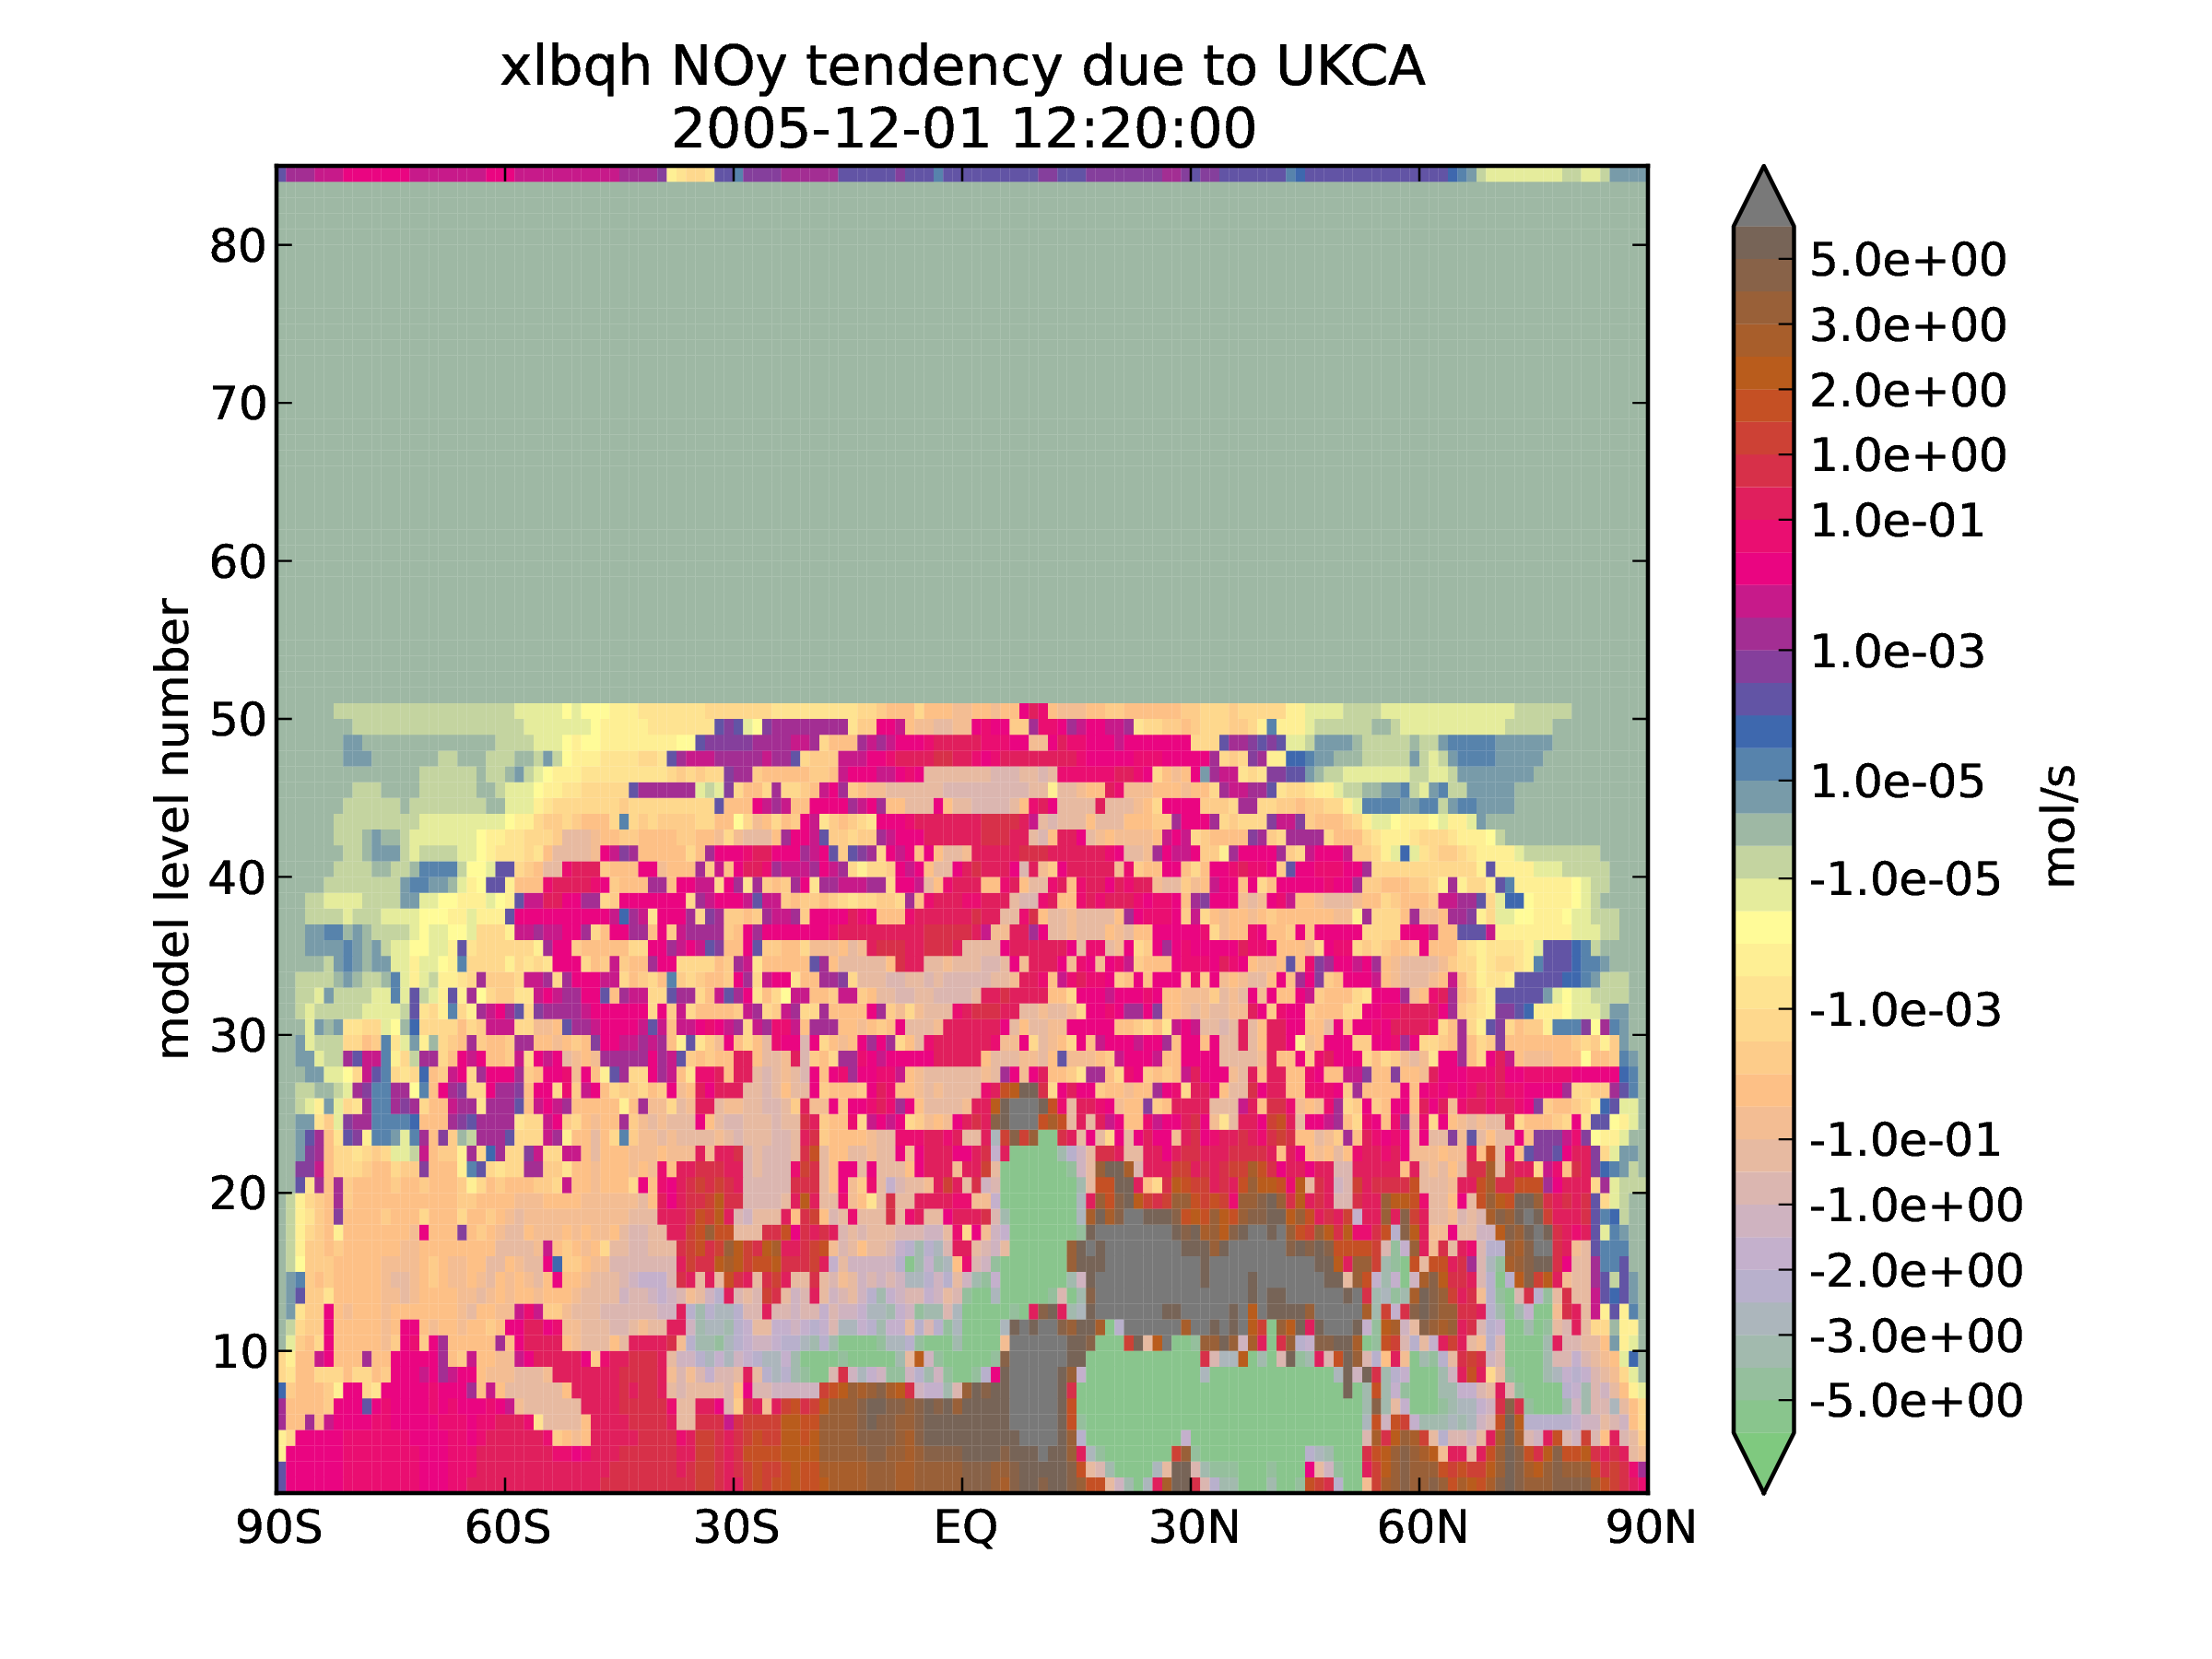
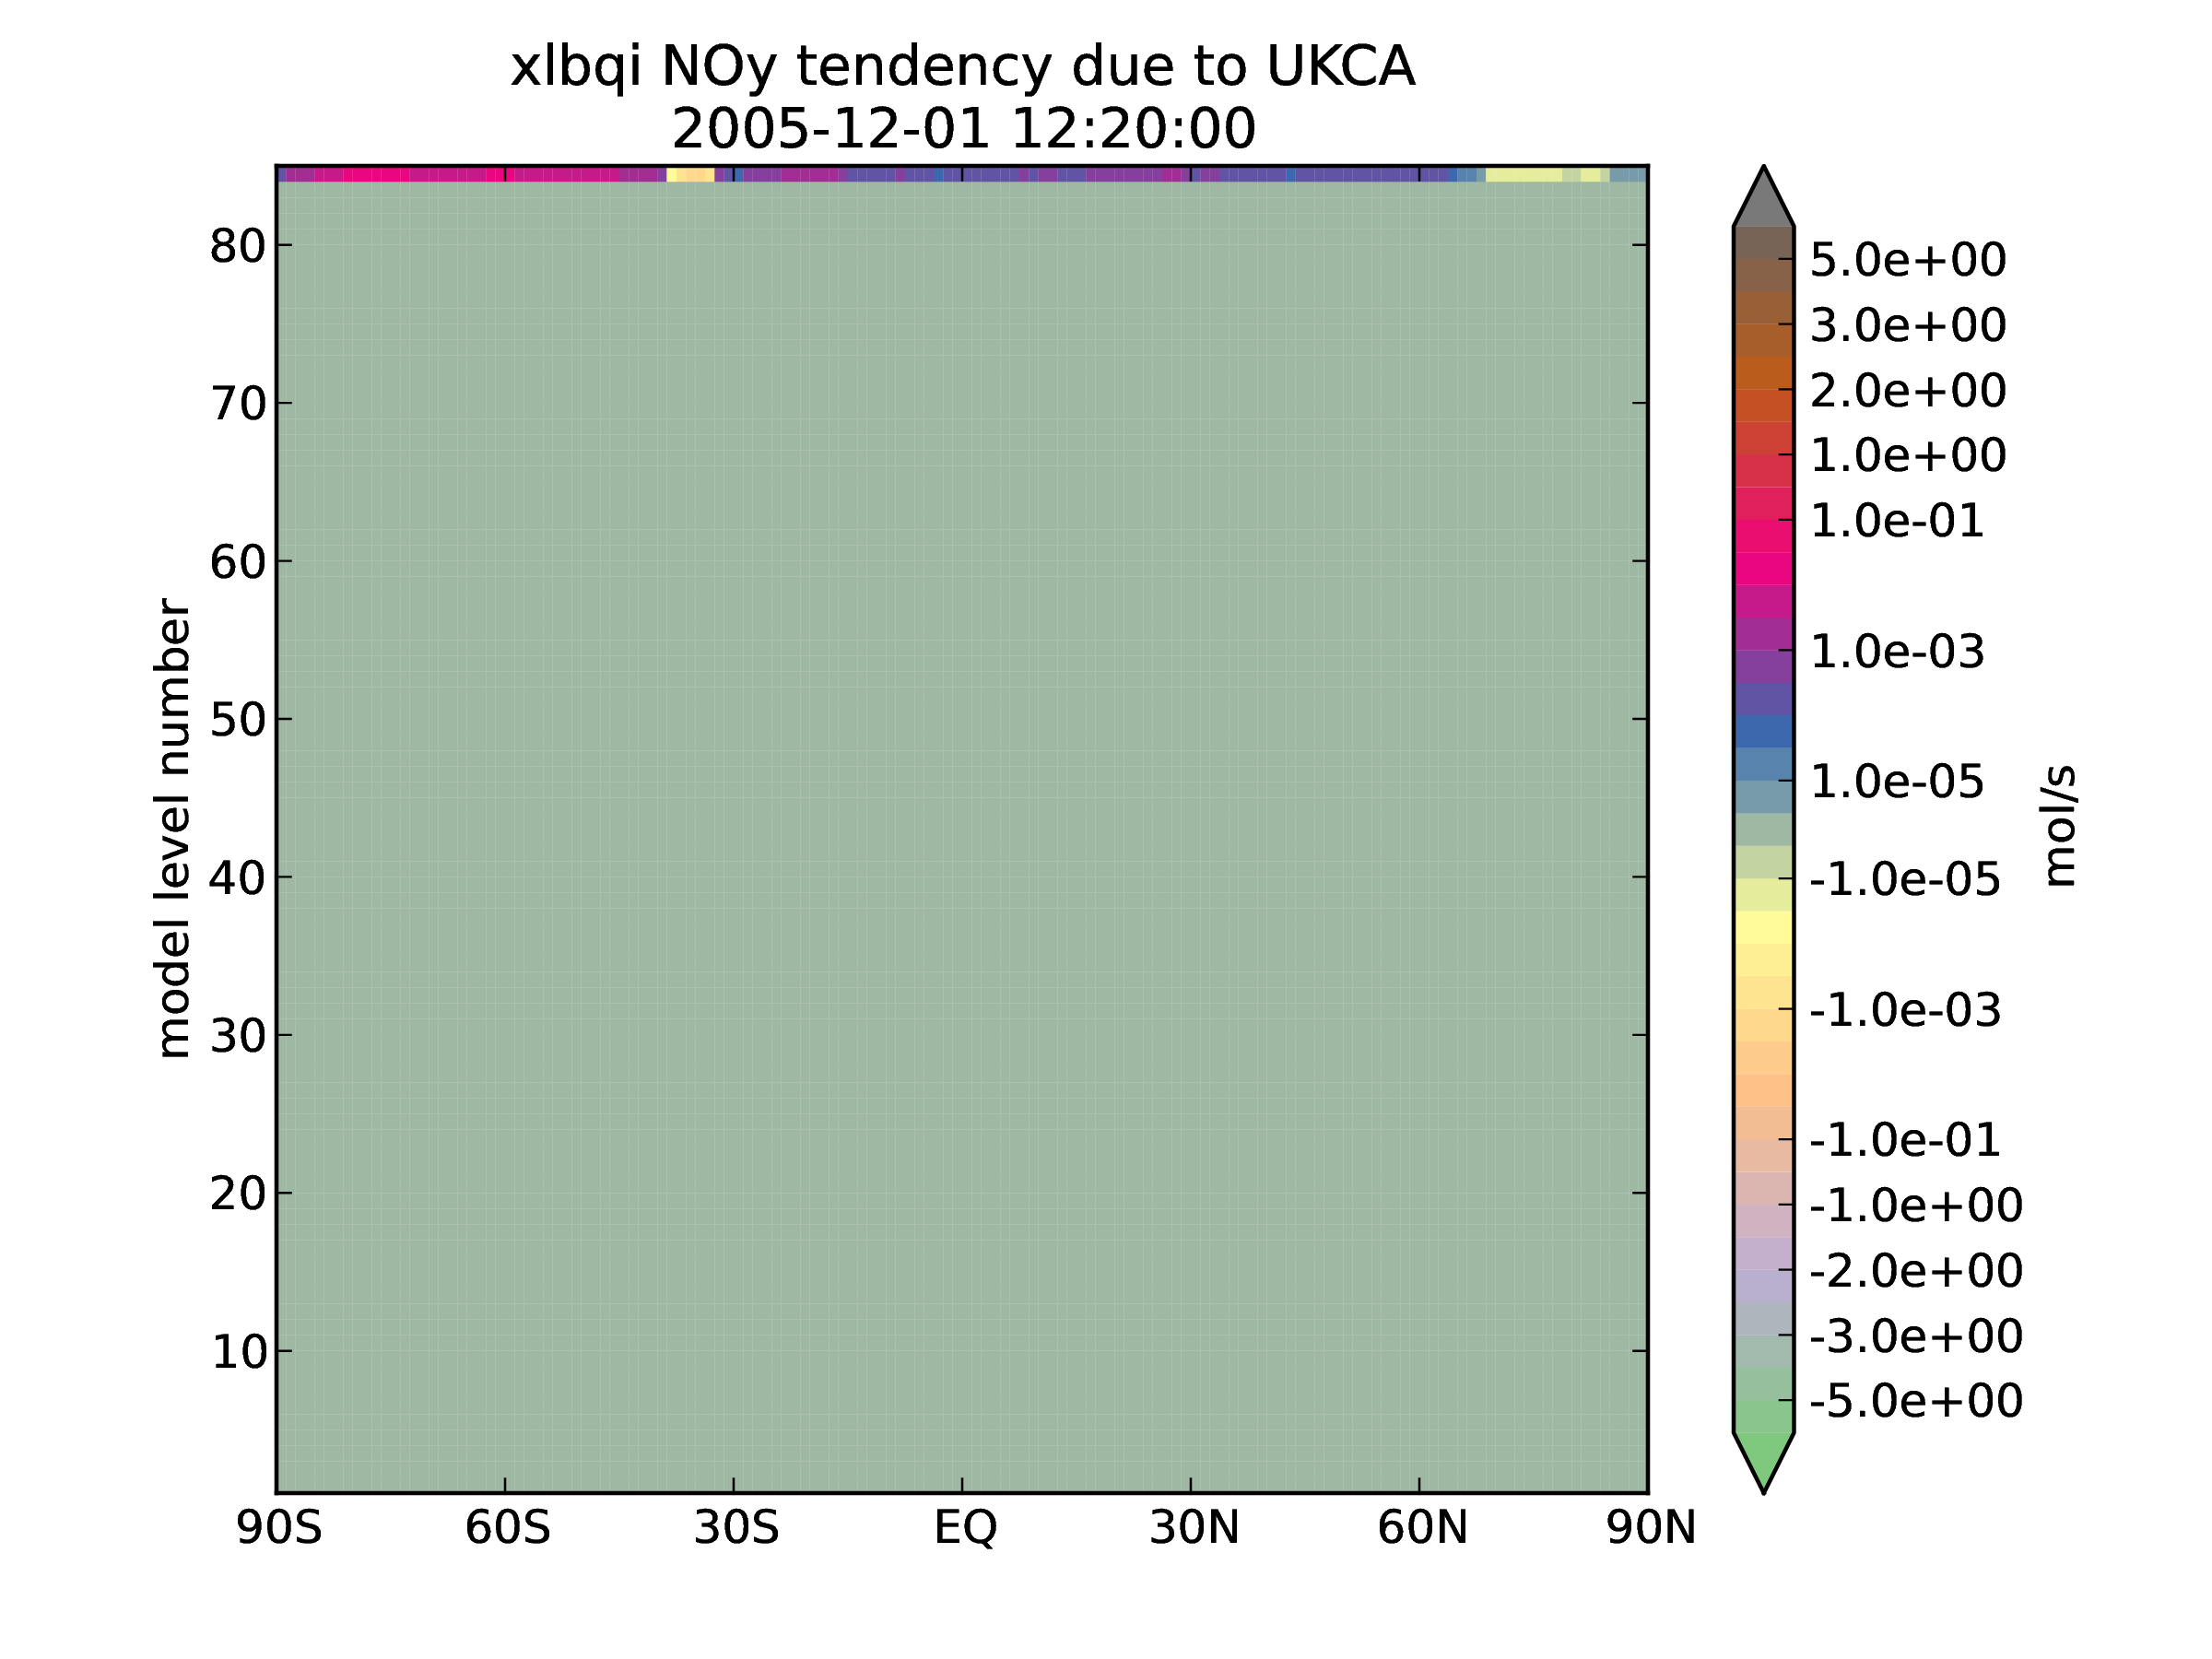
Two short test jobs were run: xlbqh which includes the call to TR_MIX; and xlbqi which had the calls to TR_MIX commented out.
These runs were based on xlbqb (expt. 15) which had the NOy reactions removed from the chemistry specification.
A lot of the structure in the troposphere, and the hard-line at ~17km/level 50 comes from this call to TR_MIX.
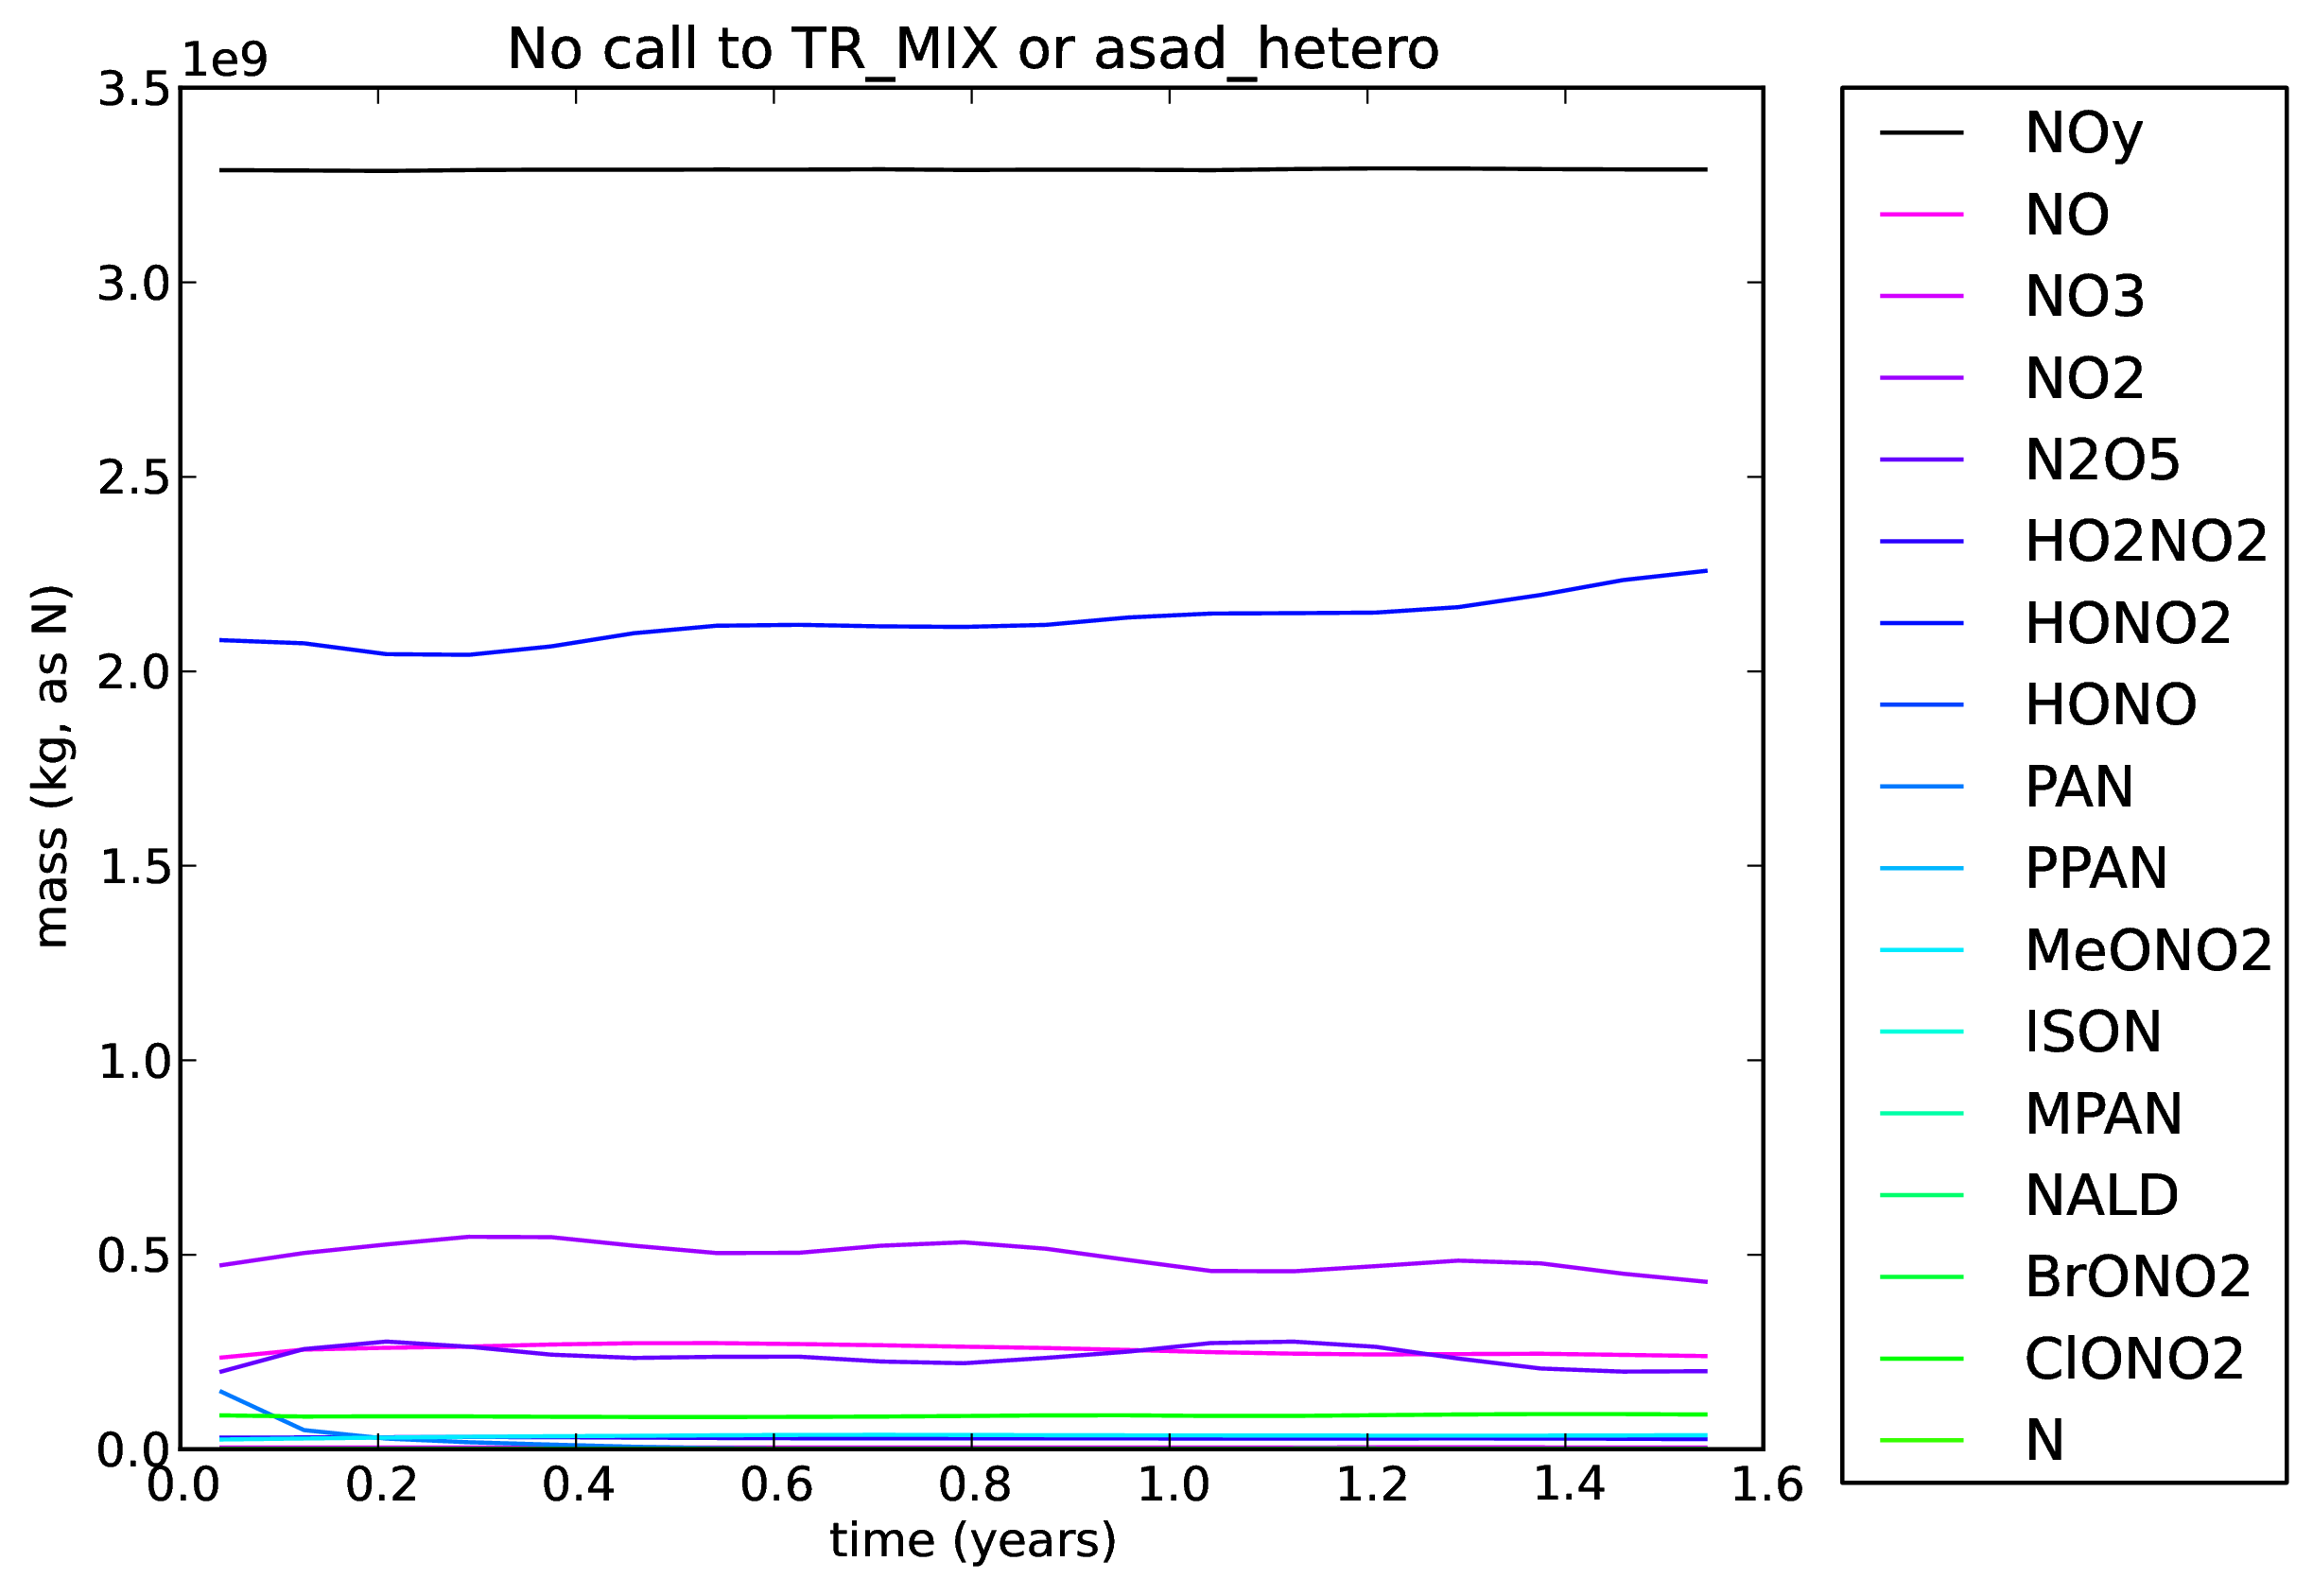
21. TR_MIX and ASAD_HETERO not called
A copy of xjciv was taken (including the doubled HNO3 initial condition). The calls to TR_MIX and ASAD_HETERO were removed. This is job xlbqm.
All plots from this run can be found here: ![]() NoTRMIX_xlbqm.pdf
NoTRMIX_xlbqm.pdf ![]()
Zonal-mean tendency plots can be found here: ![]() NoTRMIX_xlbqm_NOy_UKCA_tendency.pdf
NoTRMIX_xlbqm_NOy_UKCA_tendency.pdf ![]()
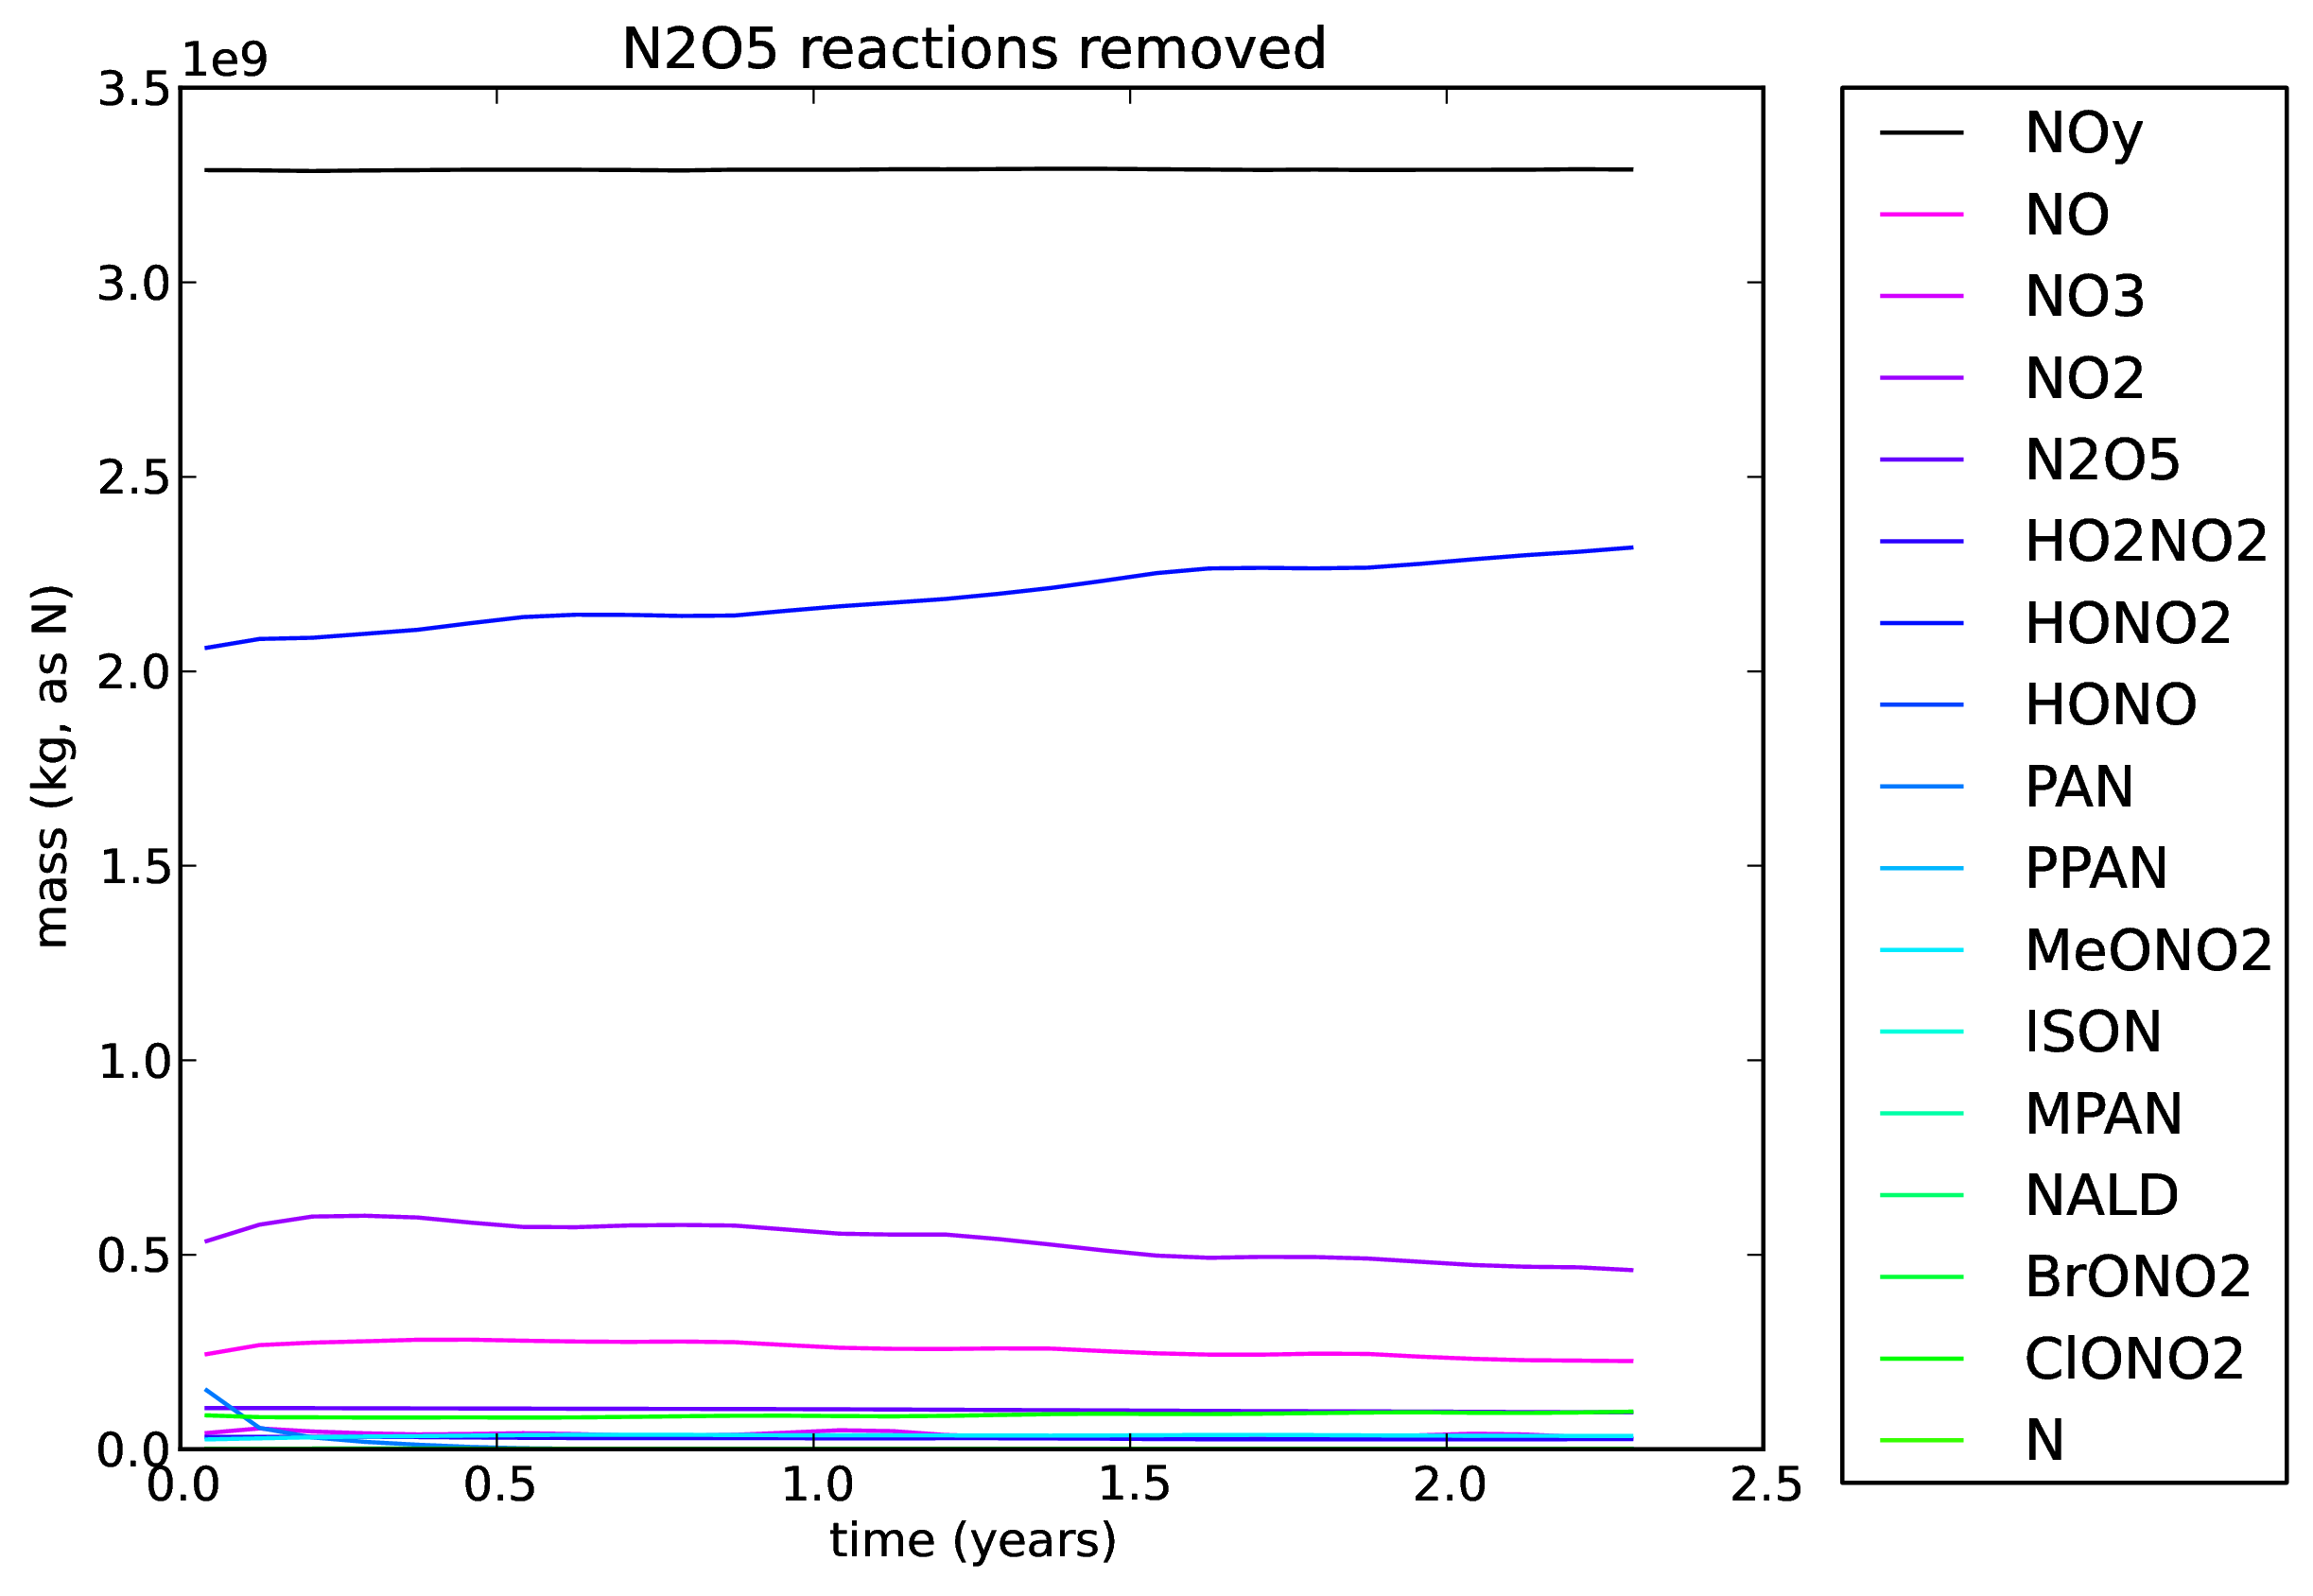
22. N2O5 reactions removed
A copy of xlbqm was taken (including the doubled HNO3 initial condition). All remaining reactions involving N2O5 were removed. This is job xlbqj.
All plots from this run can be found here: ![]() NoN2O5_xlbqj.pdf
NoN2O5_xlbqj.pdf ![]()
Zonal-mean tendency plots can be found here: ![]() NoN2O5_xlbqj_NOy_UKCA_tendency.pdf
NoN2O5_xlbqj_NOy_UKCA_tendency.pdf ![]()
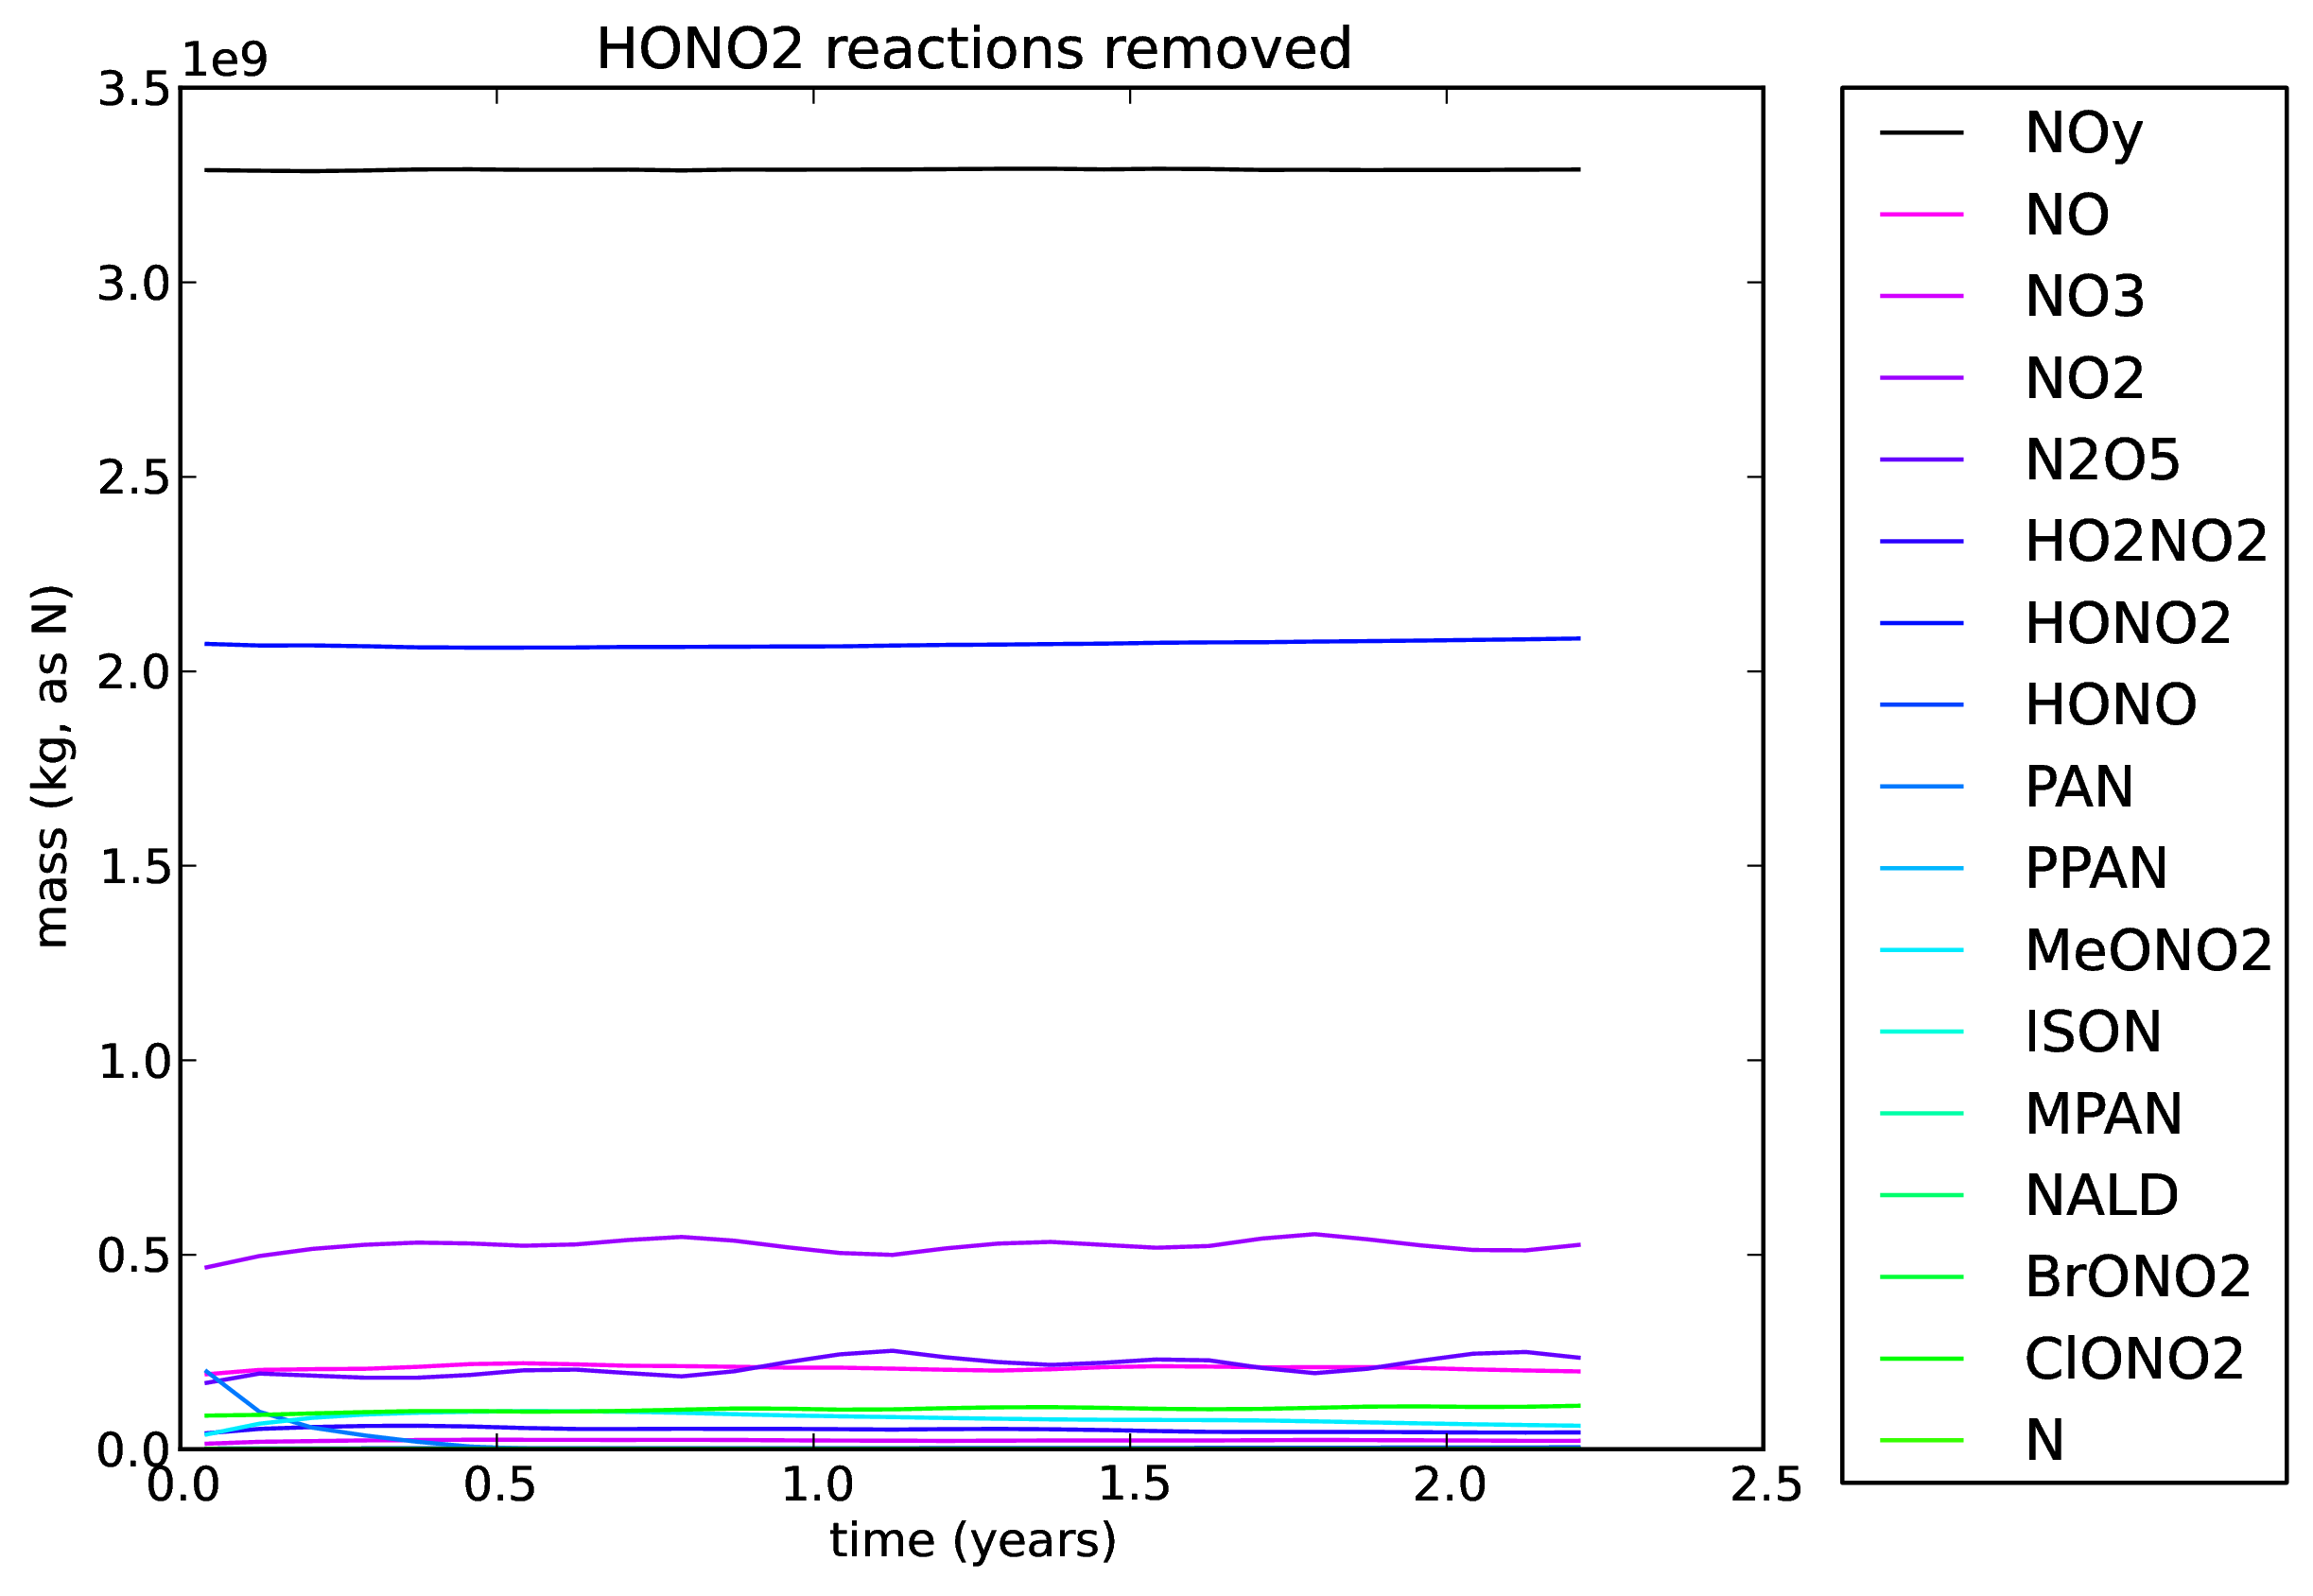
23. HNO3 reactions removed
A copy of xlbqm was taken (including the doubled HNO3 initial condition). All remaining reactions involving HNO3 were removed. This is job xlbqk.
All plots from this run can be found here: ![]() NoHONO2_xlbqk.pdf
NoHONO2_xlbqk.pdf ![]()
Zonal-mean tendency plots can be found here: ![]() NoHONO2_xlbqk_NOy_UKCA_tendency.pdf
NoHONO2_xlbqk_NOy_UKCA_tendency.pdf ![]()
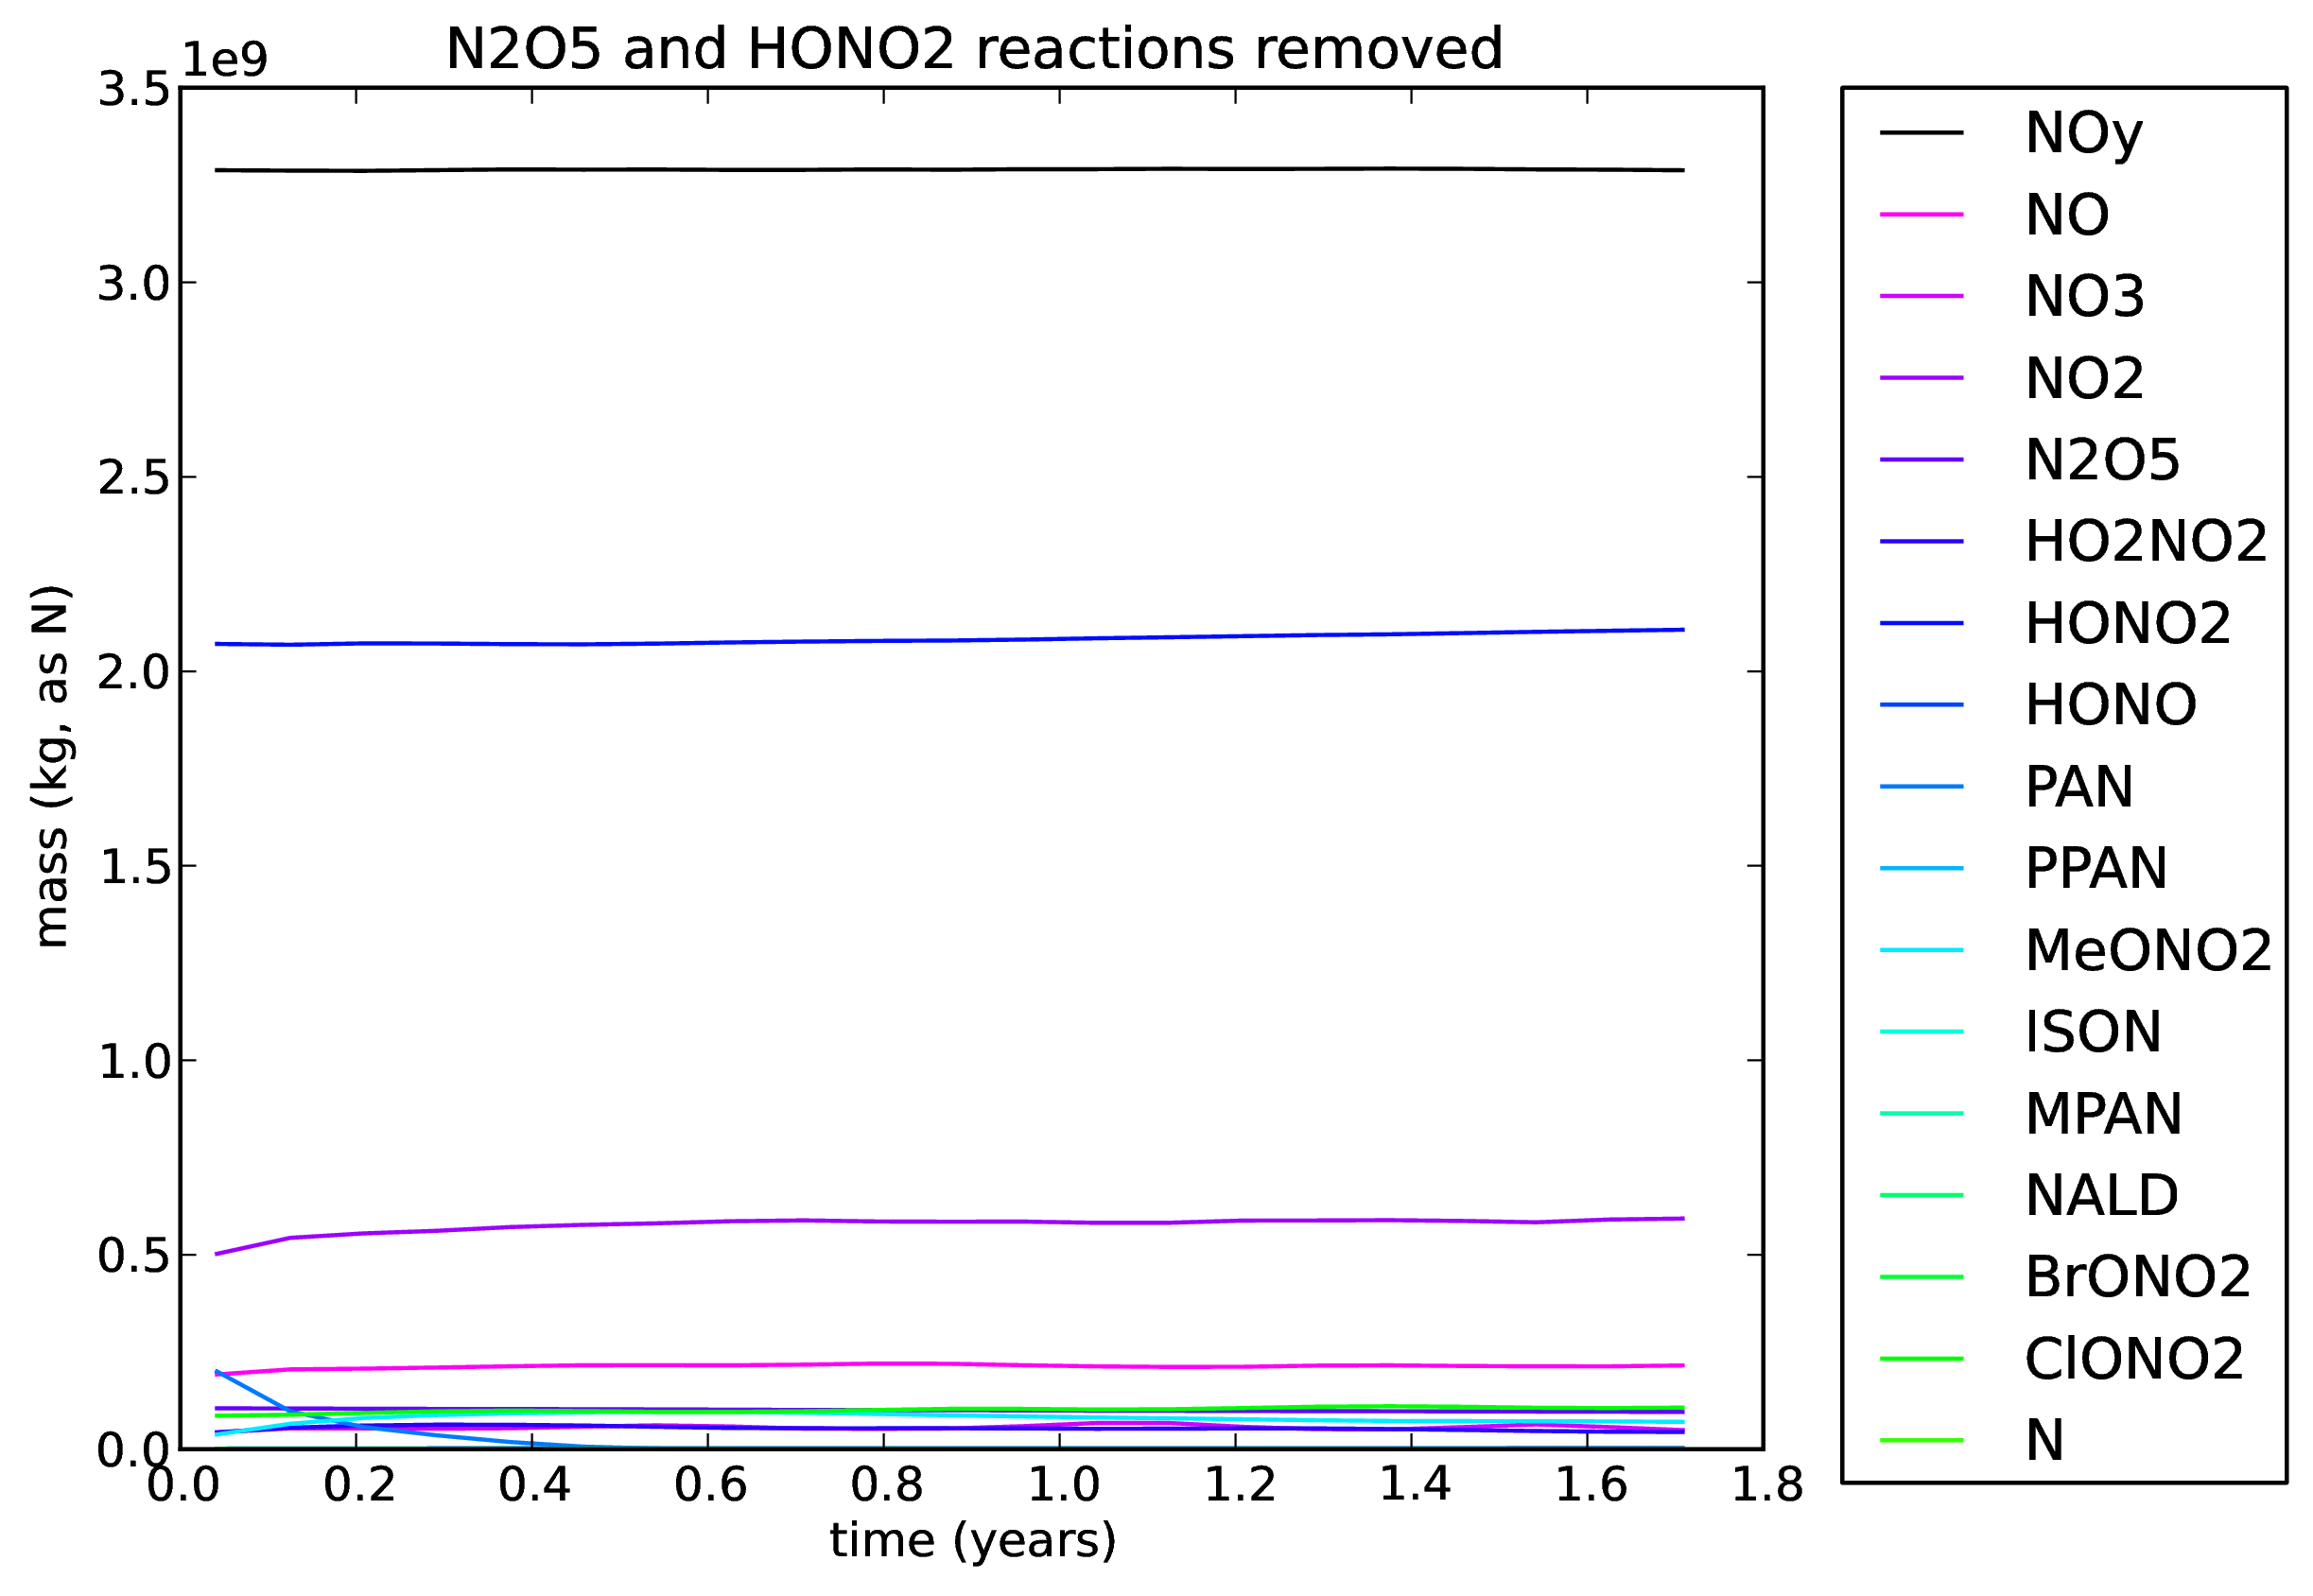
24. N2O5 and HNO3 reactions removed
A copy of xlbqm was taken (including the doubled HNO3 initial condition). All remaining reactions involving N2O5 and HNO3 were removed. This is job xlbql.
All plots from this run can be found here: ![]() NoN2O5orHONO2_xlbql.pdf
NoN2O5orHONO2_xlbql.pdf ![]()
Zonal-mean tendency plots can be found here: ![]() NoN2O5orHONO2_xlbql_NOy_UKCA_tendency.pdf
NoN2O5orHONO2_xlbql_NOy_UKCA_tendency.pdf ![]()
Comparison of xjciv, xlbqm, xlbqj, xlbqk, & xlbql
Tracers totals after various UKCA routines
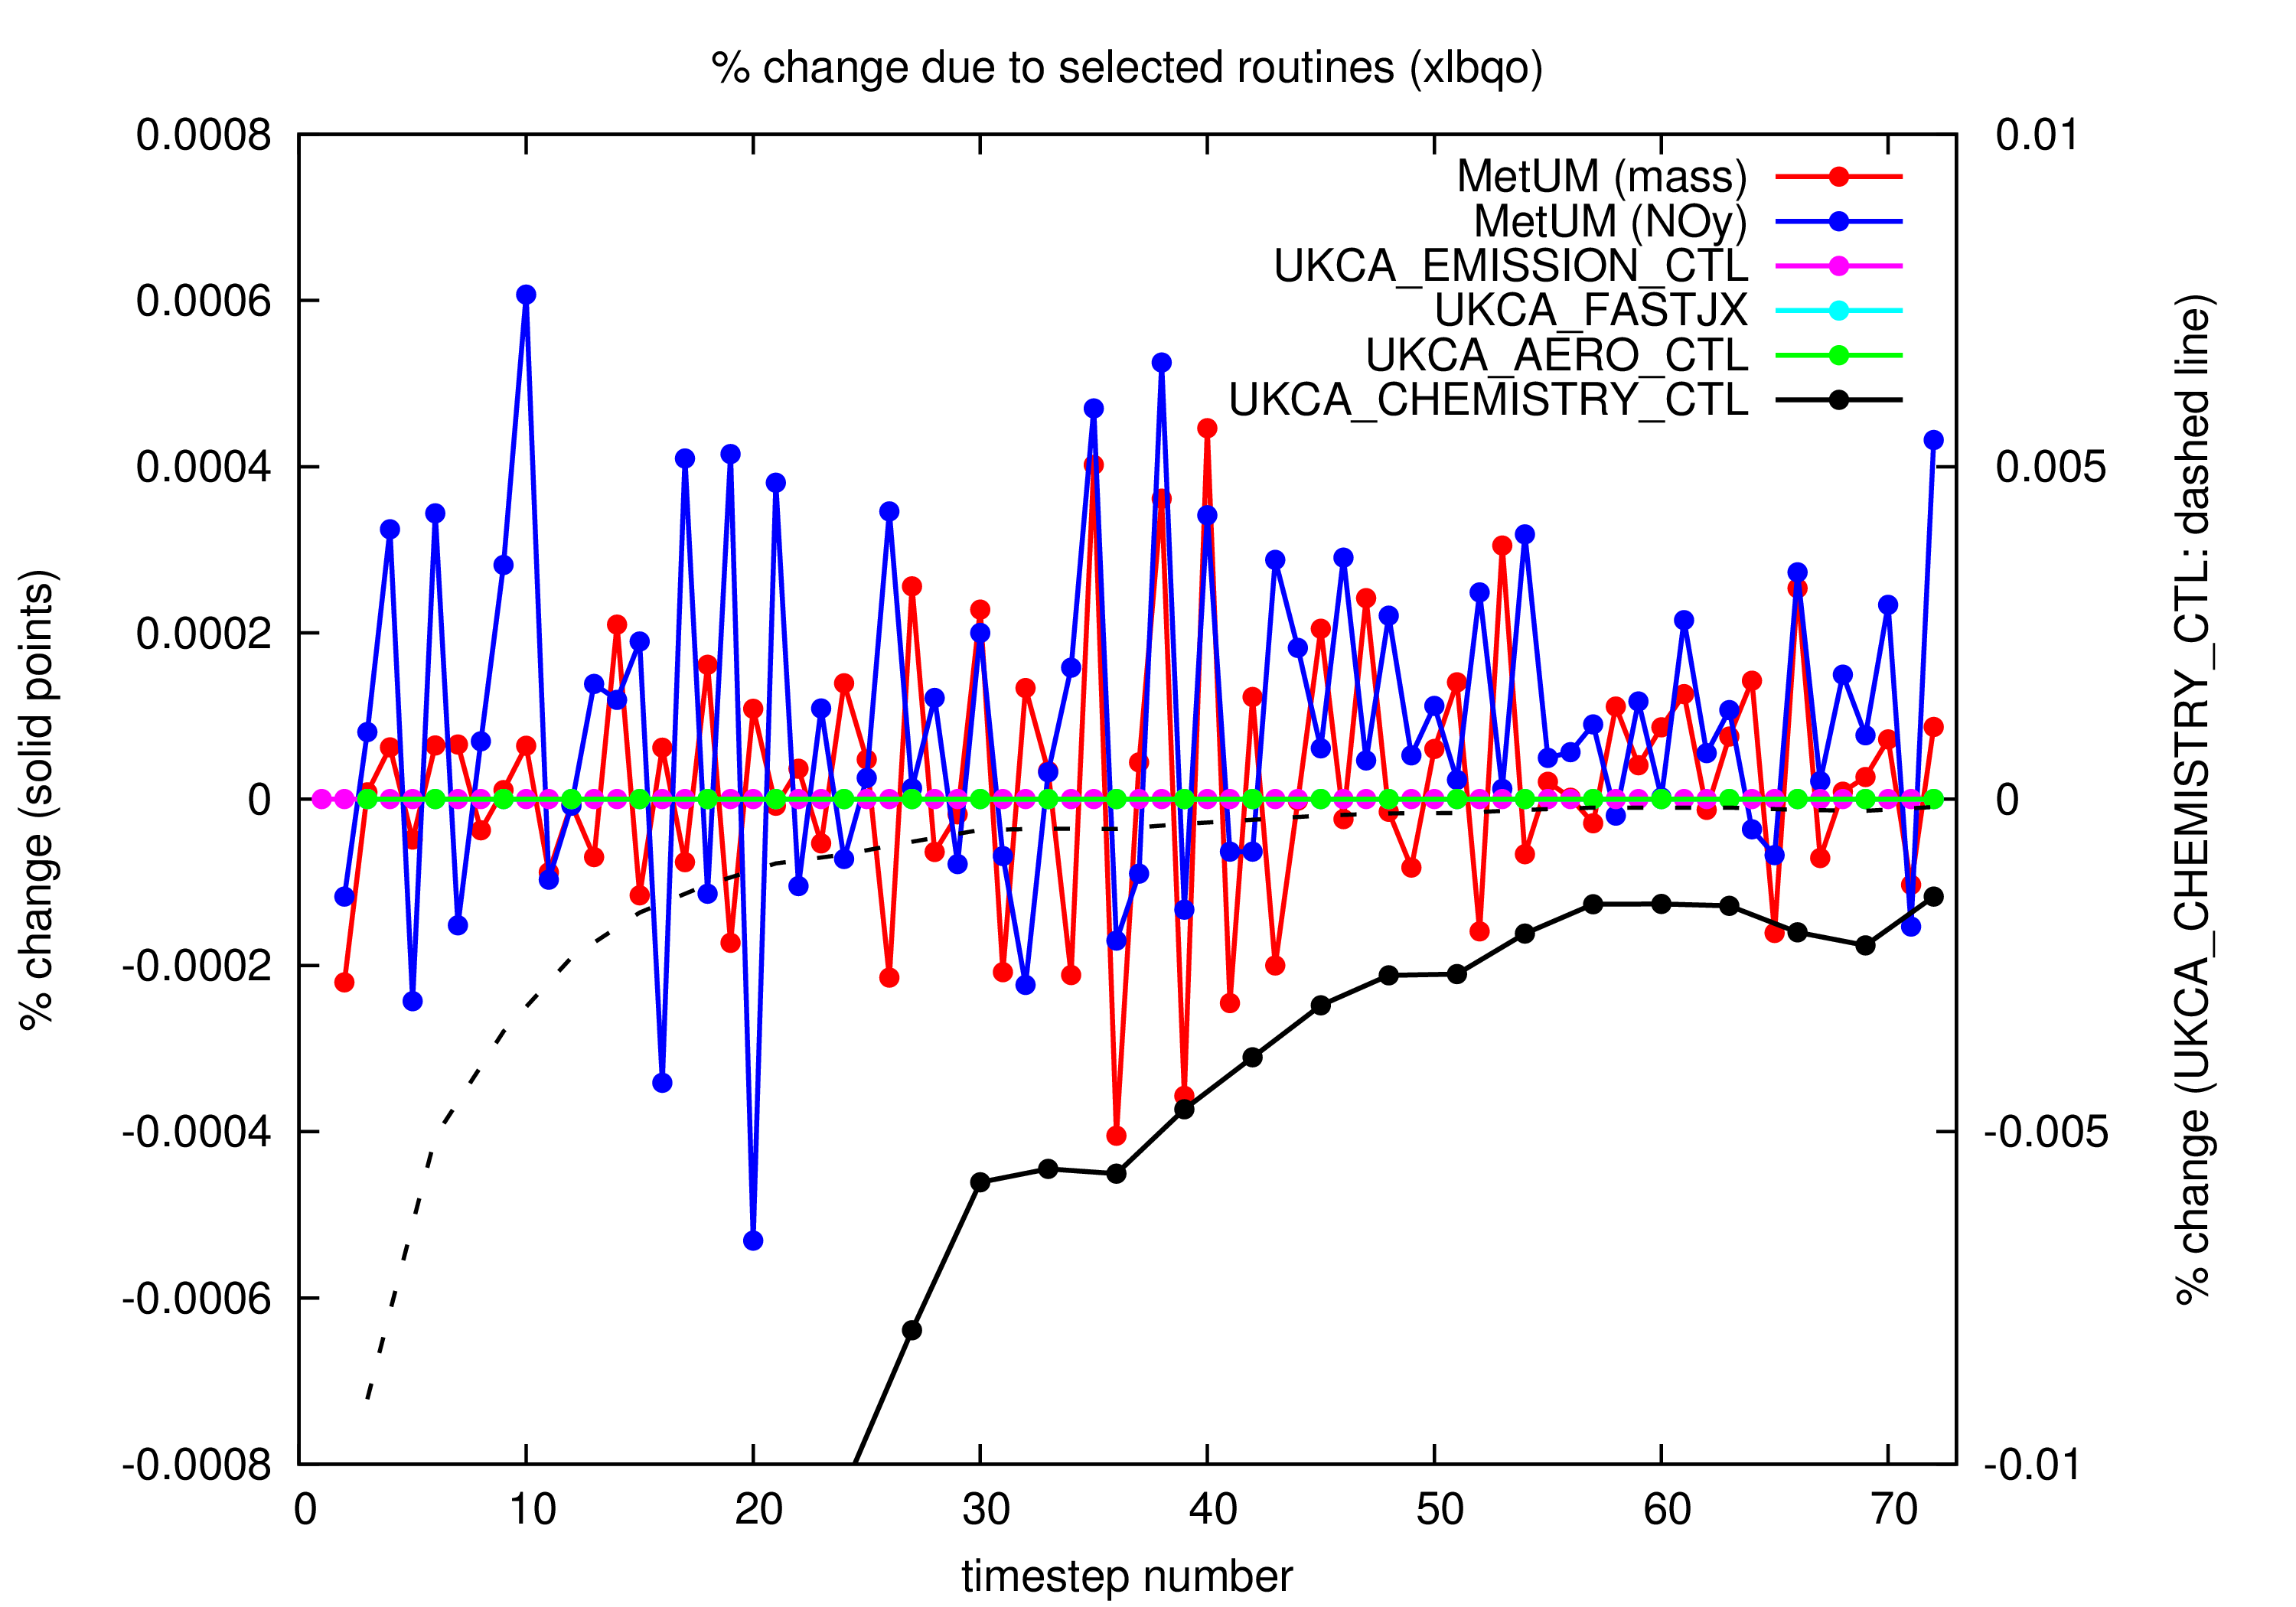
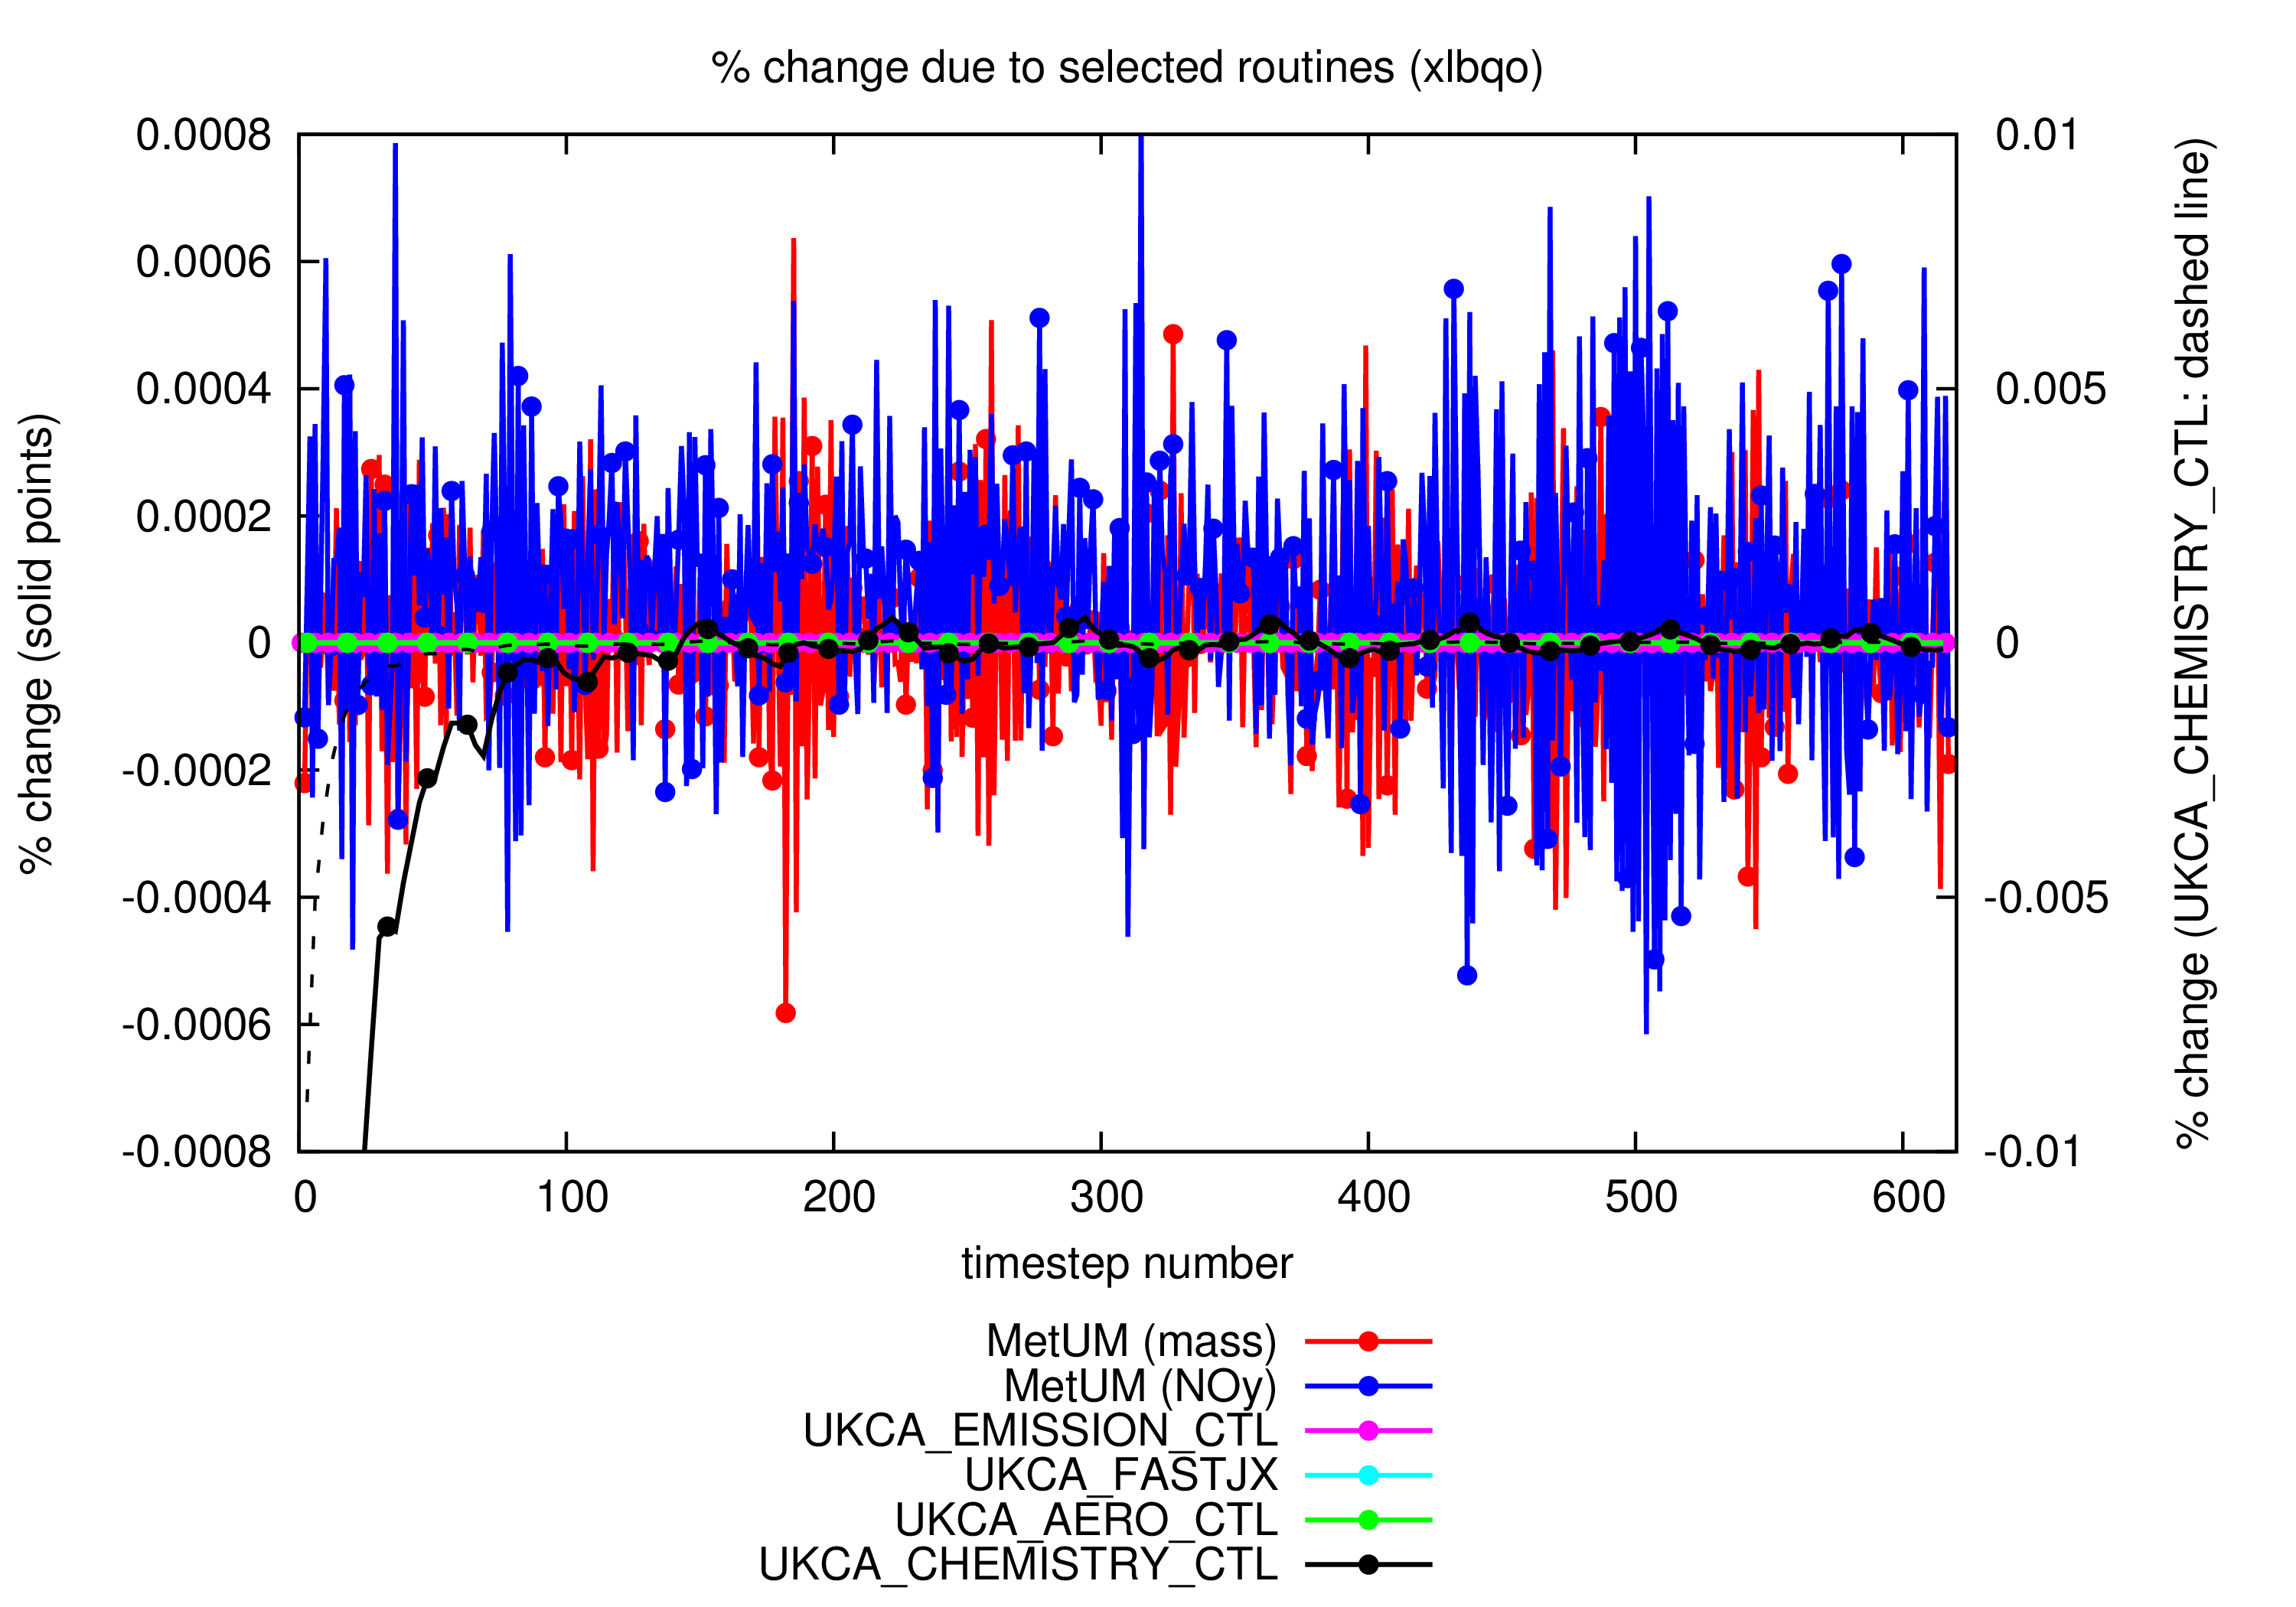
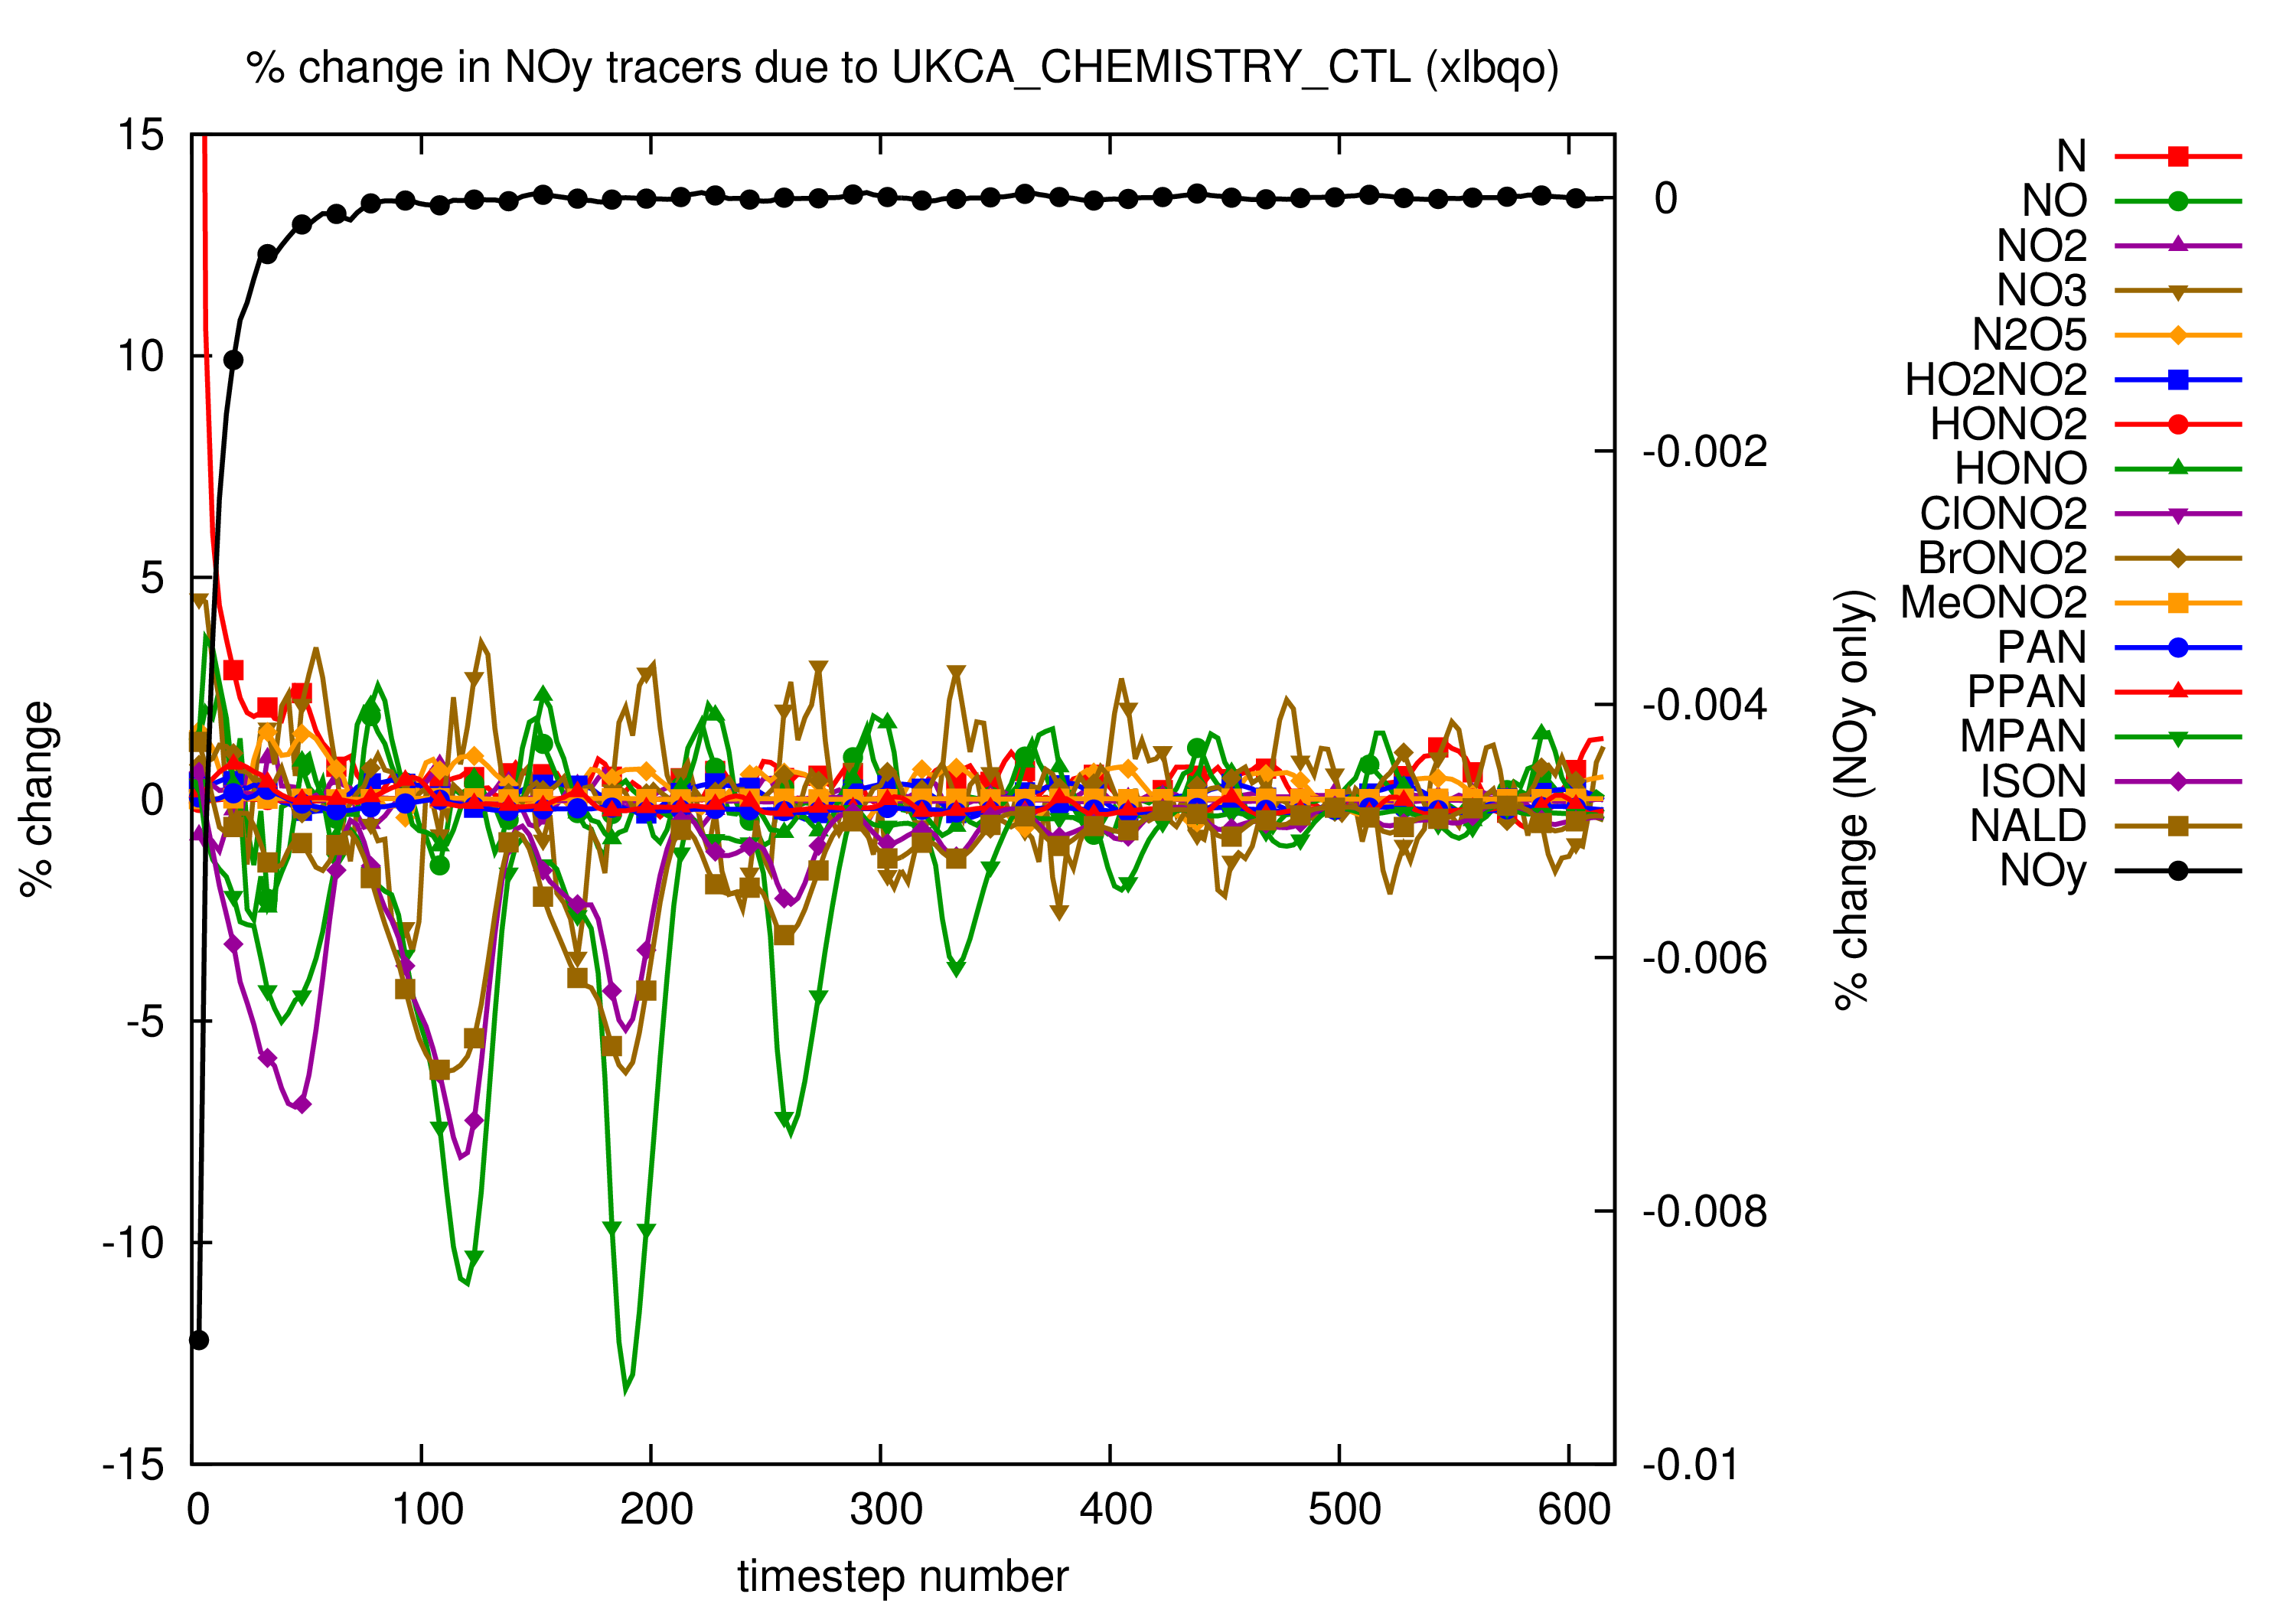
The images below show output from xlbqo (a copy of xlbqm: no TR_MIX or ASAD_HETERO) which includes a UKCA_DEBUG_TRACERS routine, which can diagnose the change in UKCA chemical tracers due to each suboutine (or the rest of the UM as a whole):
Lines are for NOy unless otherwise stated.
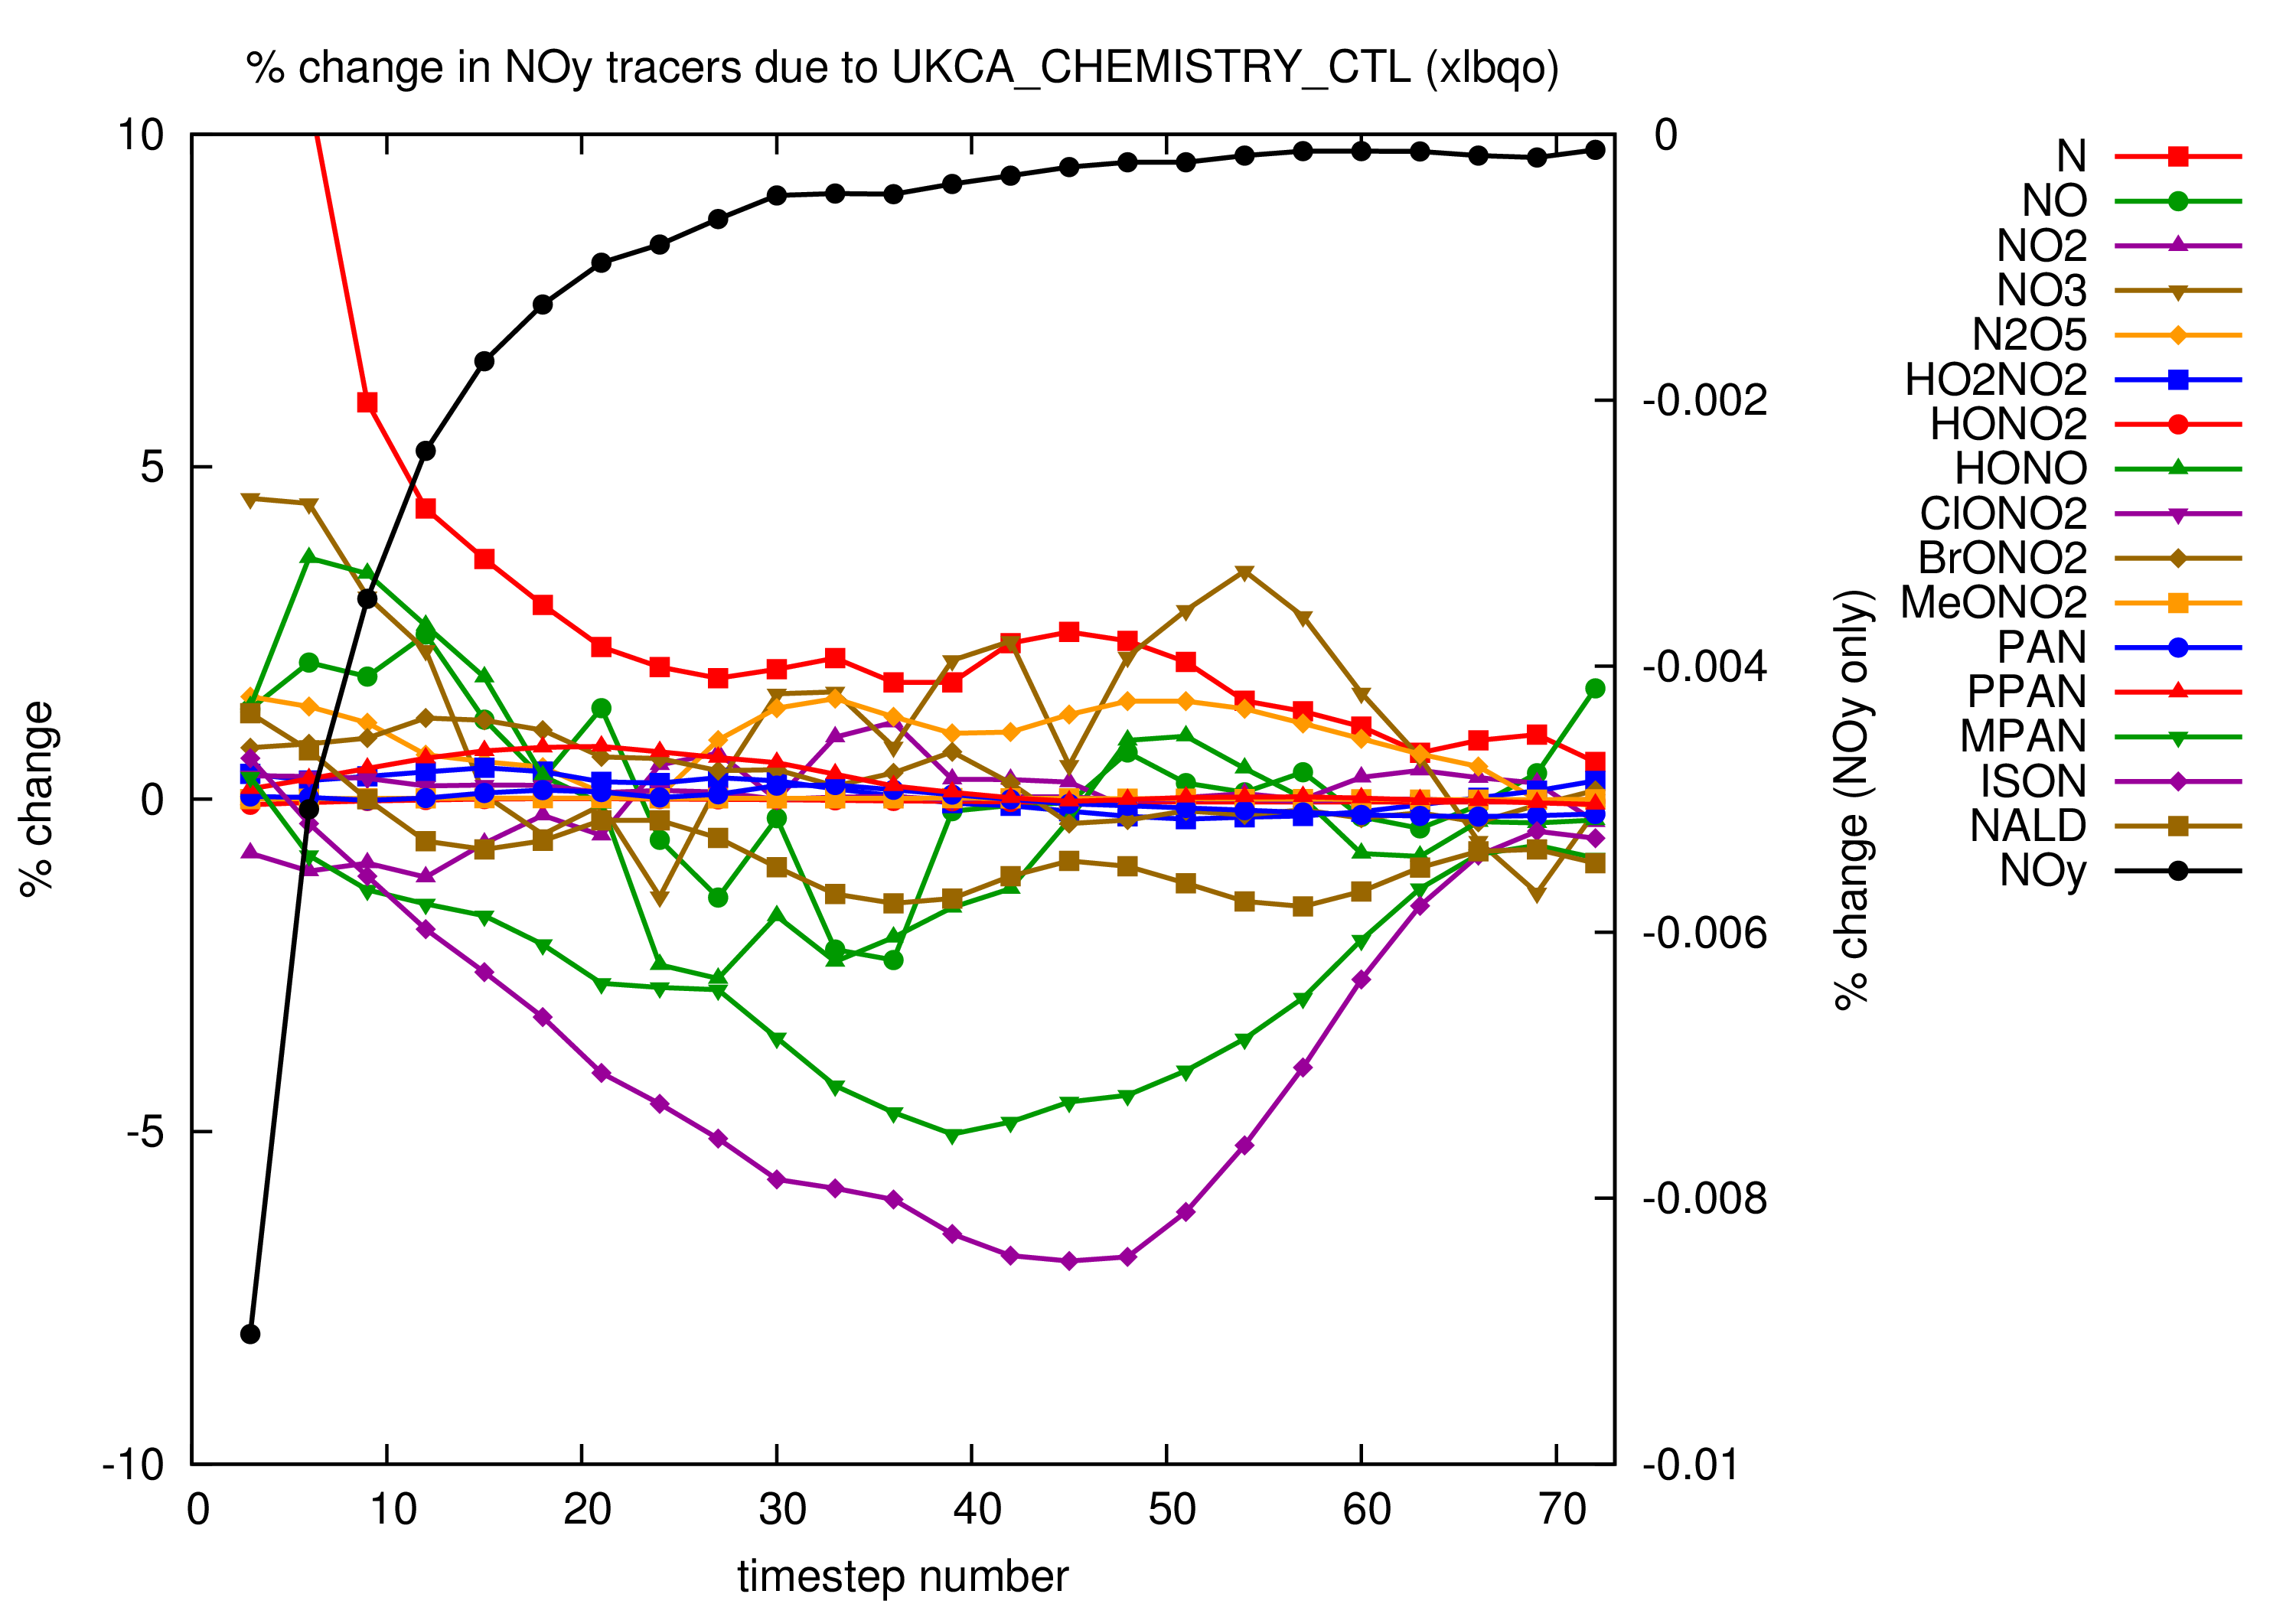
The images below show how the various NOy species are affected by UKCA_CHEMISTRY_CTL:
Note that these show the change global total mass of each tracer. Information is available for all tracers, in kg and in % change. The first image in each set are just for the 1st day of the run, the second is for
around 8.5 days of run (the UKCA_DEBUG_TRACERS slows the model down considerably, so this run hit the 3-hour wallclock limit).
Suggested Further Tests (2015-04-13)
- Adjust the above % change plots by having a MetUM, UKCA_CHEMISTRY_CTL and "the bit between the MetUM and UKCA_CHEMISTRY_CTL" and "the bit between UKCA_CHEMISTRY_CTL and the MetUM".
- Extend the
UKCA_DEBUG_TRACERSroutine so that it can work around all the different subroutines called from withinUKCA_CHEMISTRY_CTL(possibly anASAD_DEBUG_TRACERS). This will probably have to contain level-by-level information due to the way ASAD is called. - Repeat the tests which commented out the various types of reactions (and also extend this to individual reactions) and run these with these
DEBUG_TRACERSroutines on to try to assess the impact of each reaction type.
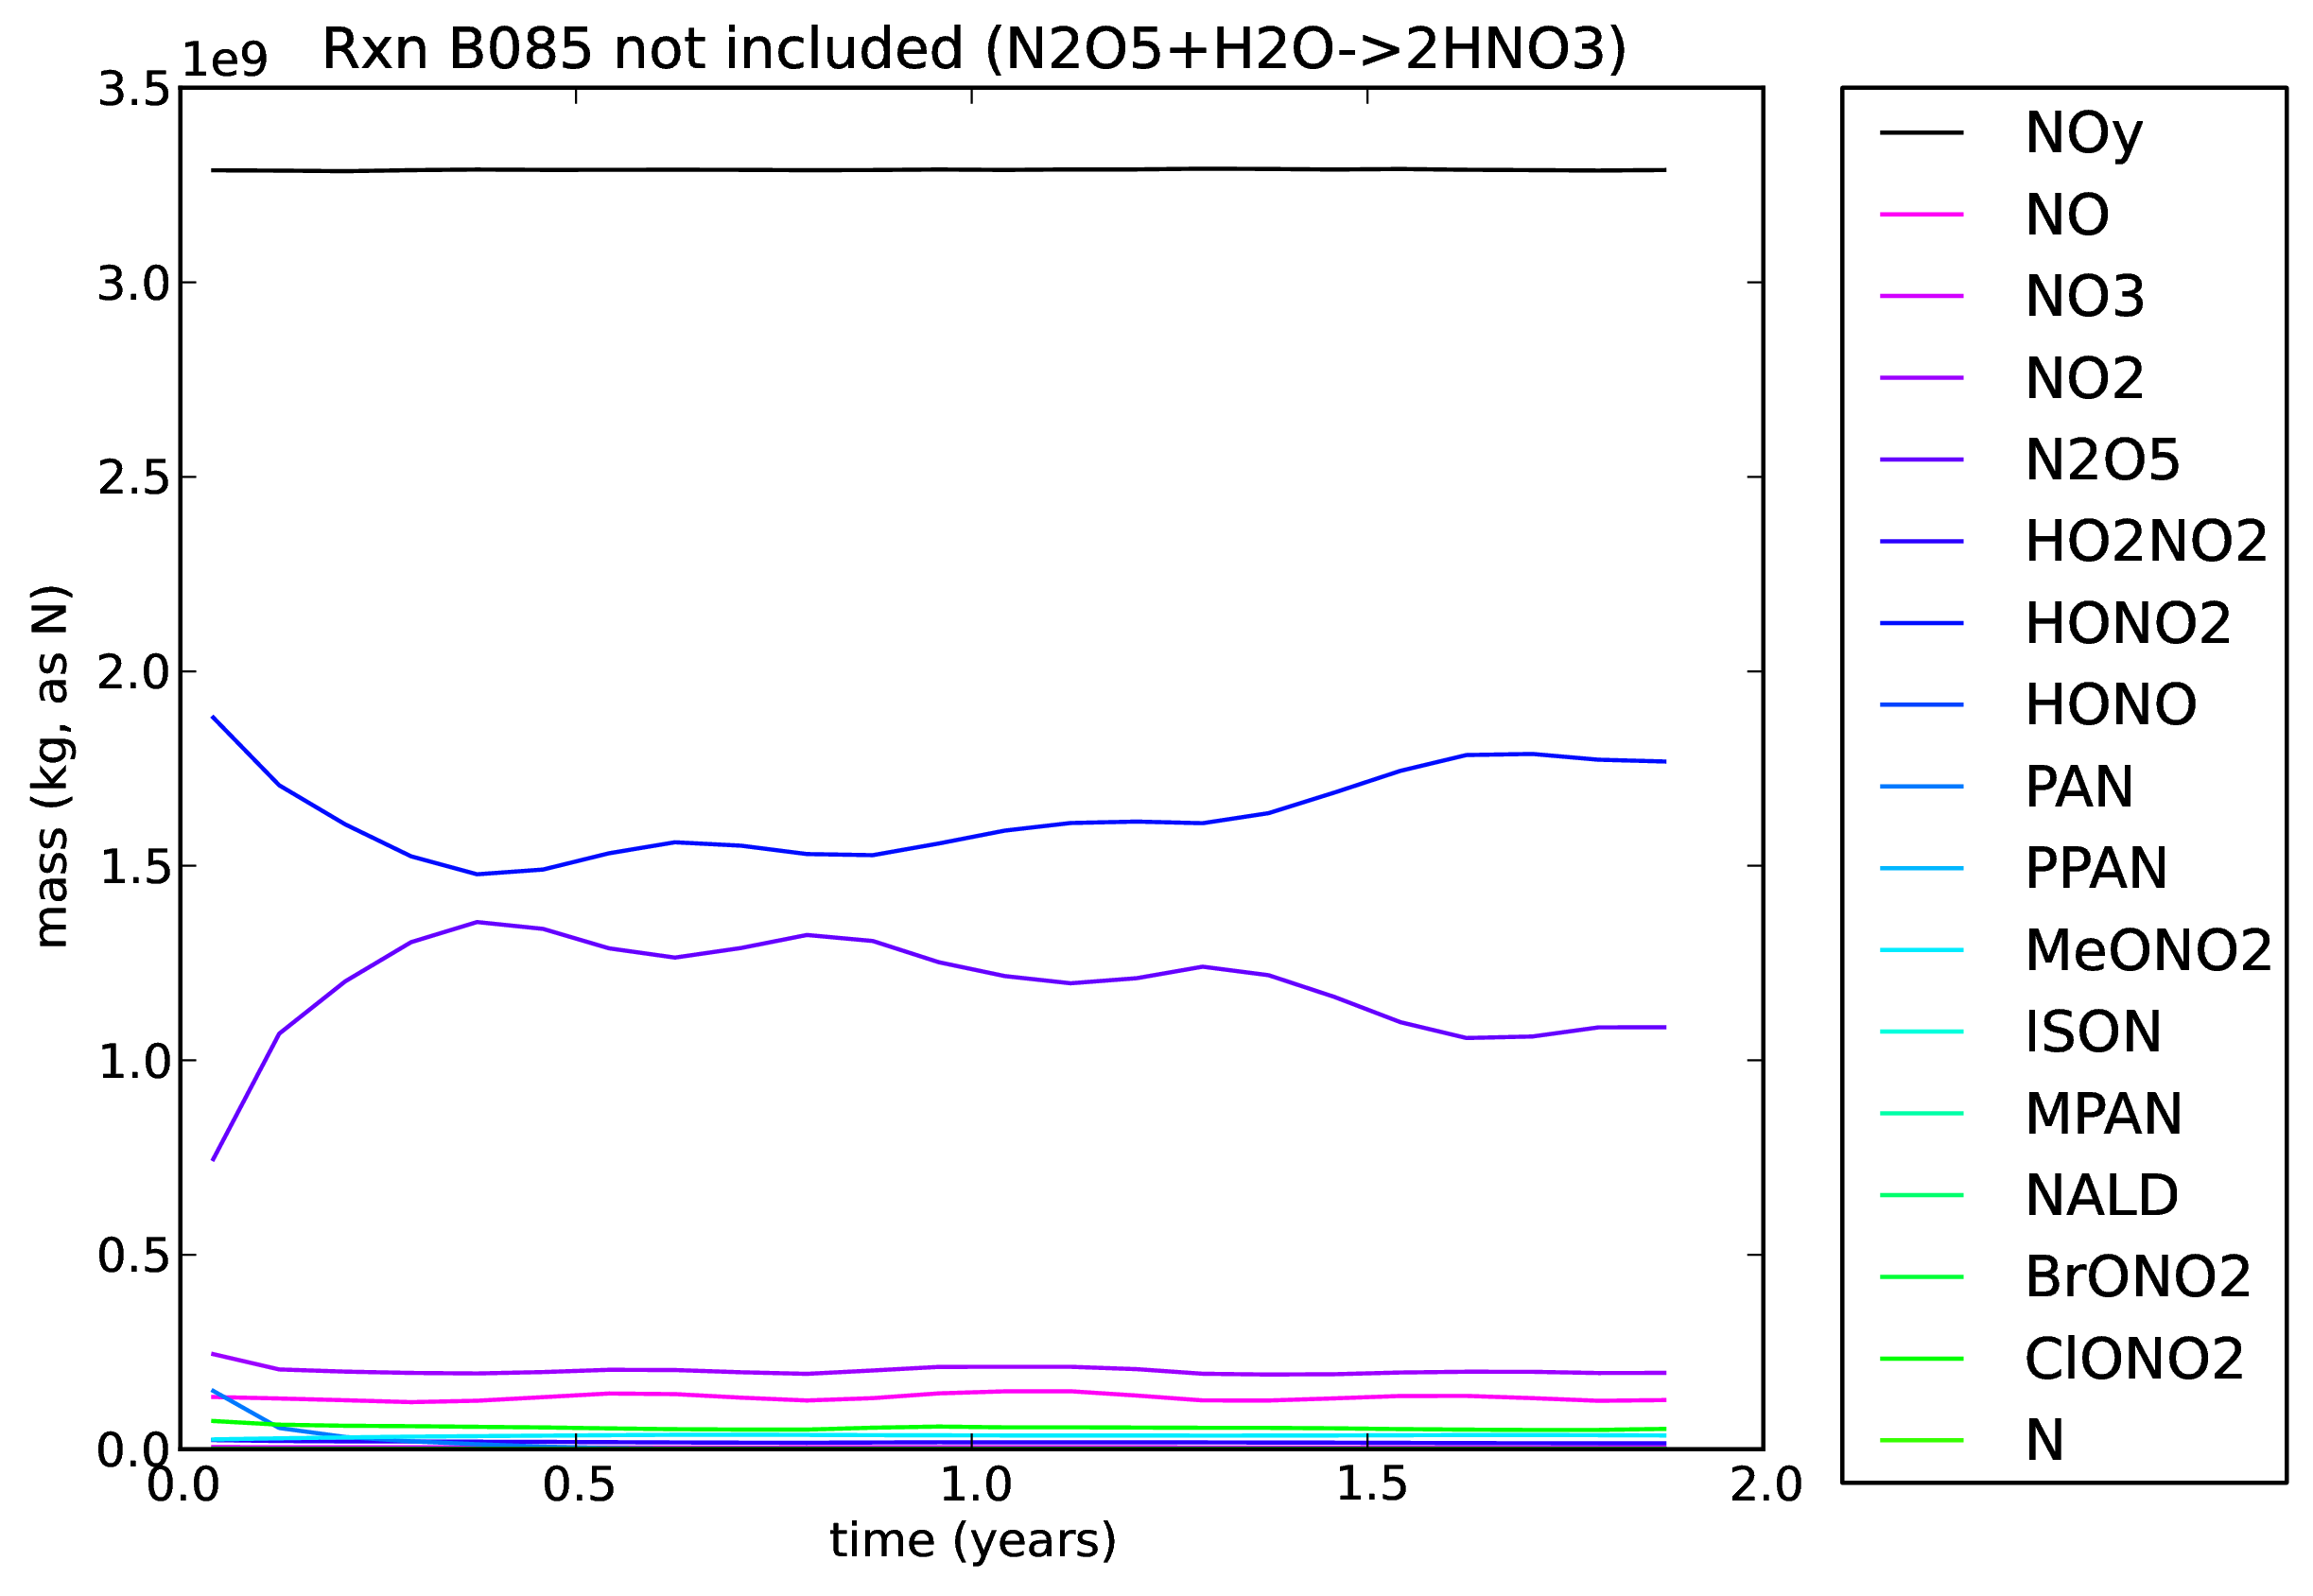
25. N2O5+H2O->2HNO3 reaction removed
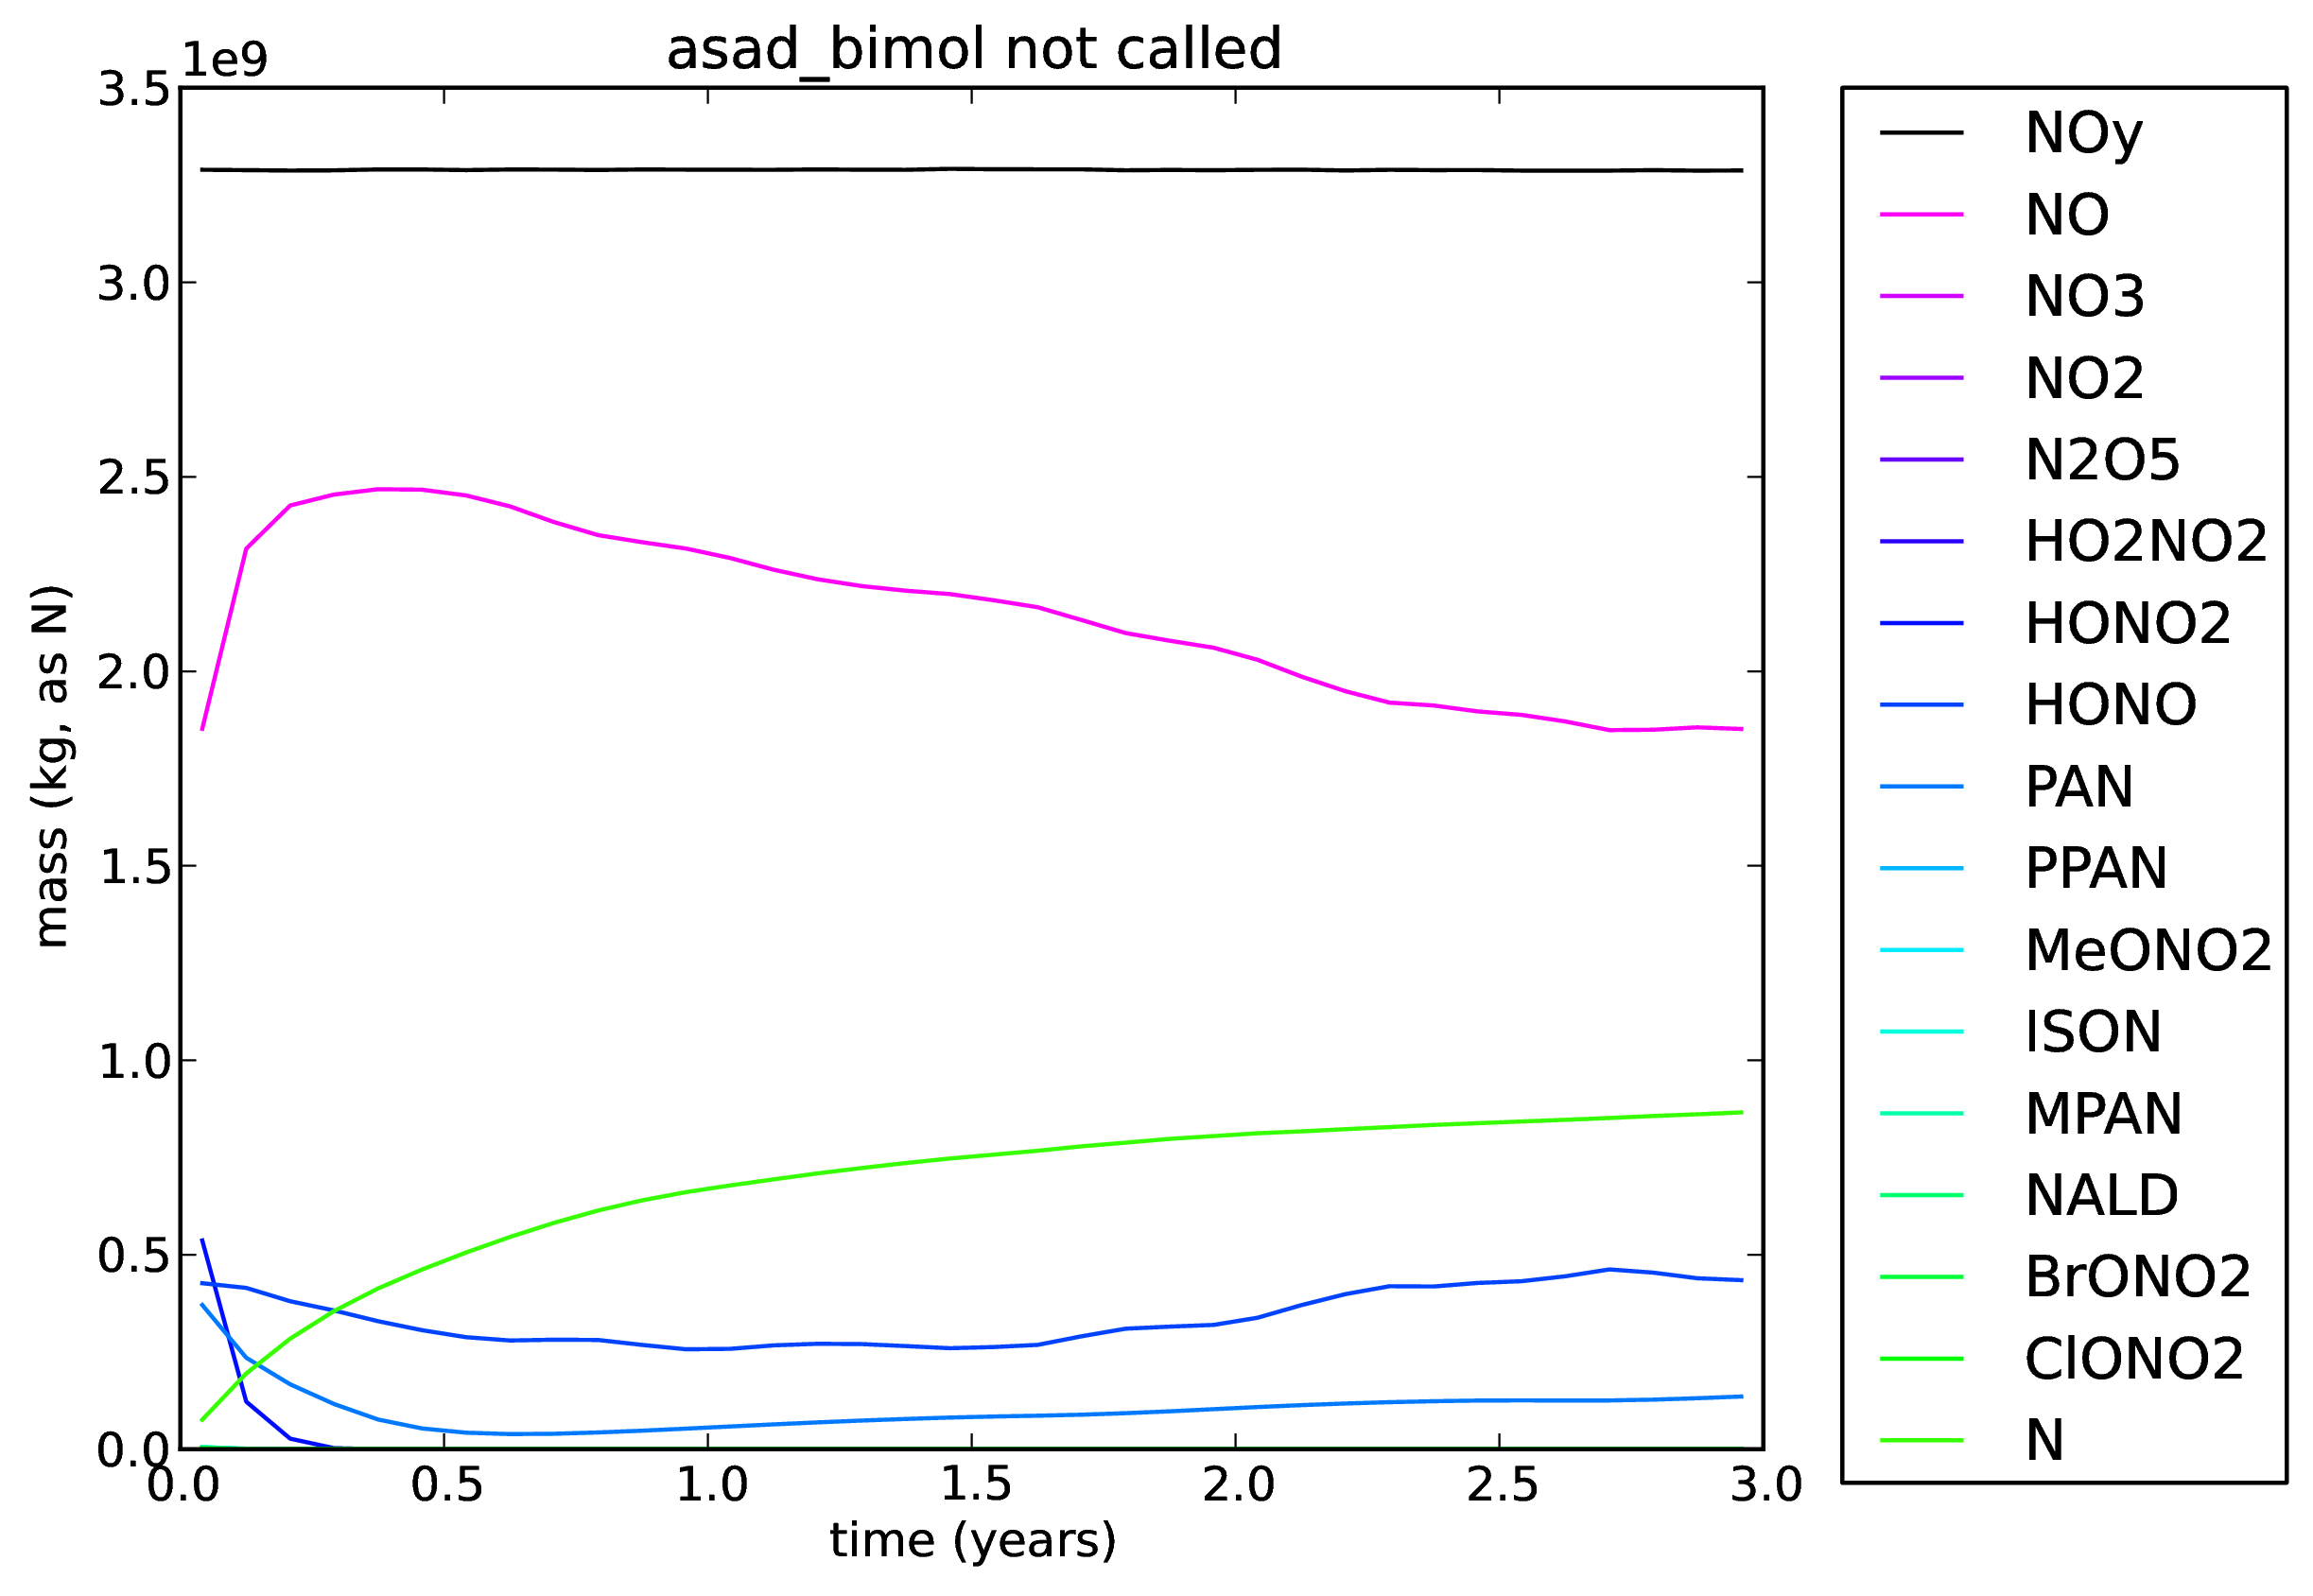
A copy of xlbqm was taken (including the doubled HNO3 initial condition). All the reaction was removed. The only two reactions that remain are:
This is job xlbqn.
All plots from this run can be found here: ![]() NoB085_xlbqn.pdf
NoB085_xlbqn.pdf ![]()
Zonal-mean tendency plots can be found here: ![]() NoB085_xlbqn_NOy_UKCA_tendency.pdf
NoB085_xlbqn_NOy_UKCA_tendency.pdf ![]()
The comparison plot has also been updated, showing the impact of this reaction's removal as compared to the more recent tests.
NOy telecon minutes 2015-04-14 2pm-3pm
Present: LA, JP, PG, AA, JK, MC
Please see also the results of the B085 reaction
being removed above (test 24), which were only added after the meeting.
Suggestions:
- Check effects of TR_MIX and ASAD_HETERO independently (c.f. xlbqm - blue line).
- Try changing the rates of the fast N2O5 termolecular reactions to slow them down and seeing what effect this has.
- Put the UKCA_DEBUG_TRACERS call around the UKCA_TRANSFORM_NITROGEN routine.
- Try comparing (e.g. the zonal-mean tendencies) to another, separate tracer, e.g. CH4, with the prod and loss reactions changed accordingly.
- This may need to be tested with a pair of interconverted tracers.
- Create ZM plots showing mass/moles of NOy, to find where it is most abundant.
- Double-check how the zonal-mean tendencies are calculated, and make sure that there aren't any mistakes.
- Change the N2O5 termolecular reactions to:
- with the rates adjusted accordingly. Do this in a run which has B085 removed, leaving these as the only N2O5 reactions and then compare to xlbqn.
- Look into what debugging settings/options are available in the solver.
- Redo the Base run (xjcis) to remove all the N2O5 reactions and see how this looks.
MC suggested that we should try to not lose sight of the original problem. It would be a good idea for the Base run (xjcis) to be included in all comparison plots, as well as bringing suggested ideas back to be run in the Base (c.f. xjcis) configuration.
26. N2O5 reactions/deposition removed from Base simulation
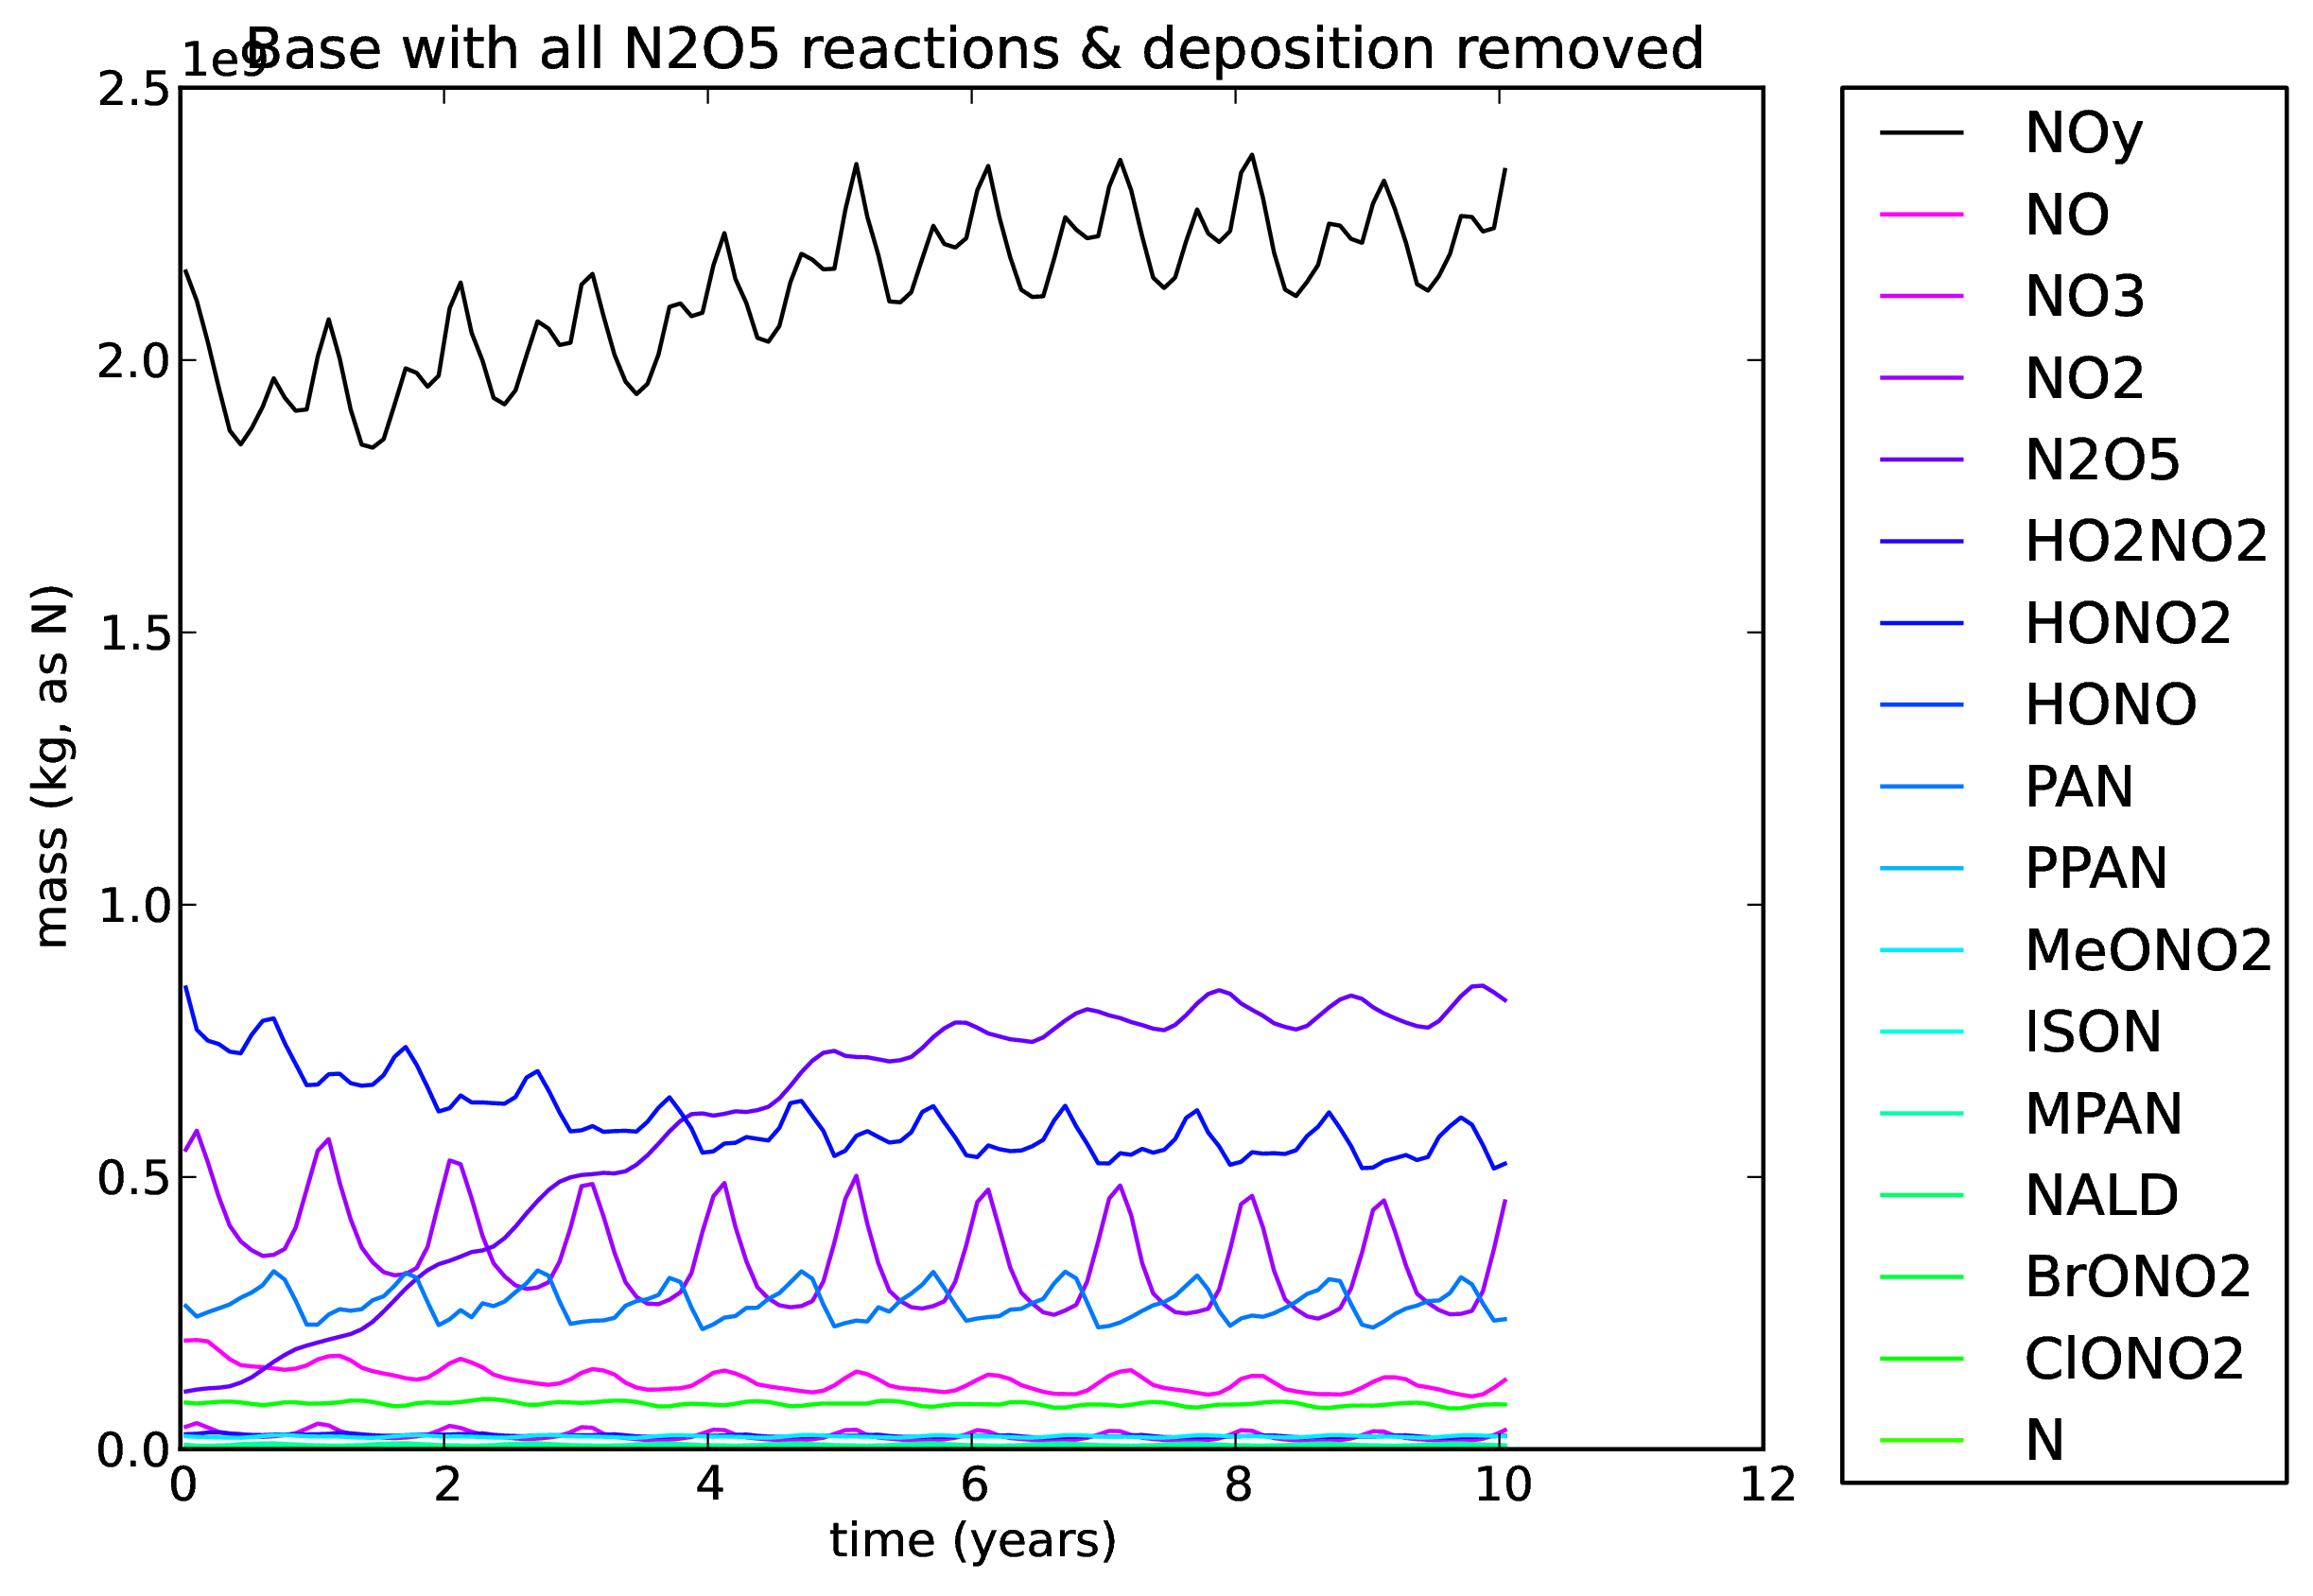
A copy of xjcis was taken. All the reactions involving N2O5 were removed, as was N2O5 deposition. This is job xlbqp.
All plots from this run can be found here: ![]() BaseNoN2O5_xlbqp.pdf
BaseNoN2O5_xlbqp.pdf ![]()
Zonal-mean tendency plots can be found here: ![]() BaseNoN2O5_xlbqp_NOy_UKCA_tendency.pdf
BaseNoN2O5_xlbqp_NOy_UKCA_tendency.pdf ![]()
The comparison plot has also been updated, showing the impact of this reaction's removal as compared to the more recent tests.
27. No call to ASAD_BIMOL
A copy of xjciv was taken and the interactive O3 was turned off. The calculation of t300 was moved from asad_bimol to asad_cdrive where the call to asad_bimol was also commented out. This is job xlbqr.
All plots from this run can be found here: ![]() NoBimol_xlbqr.pdf
NoBimol_xlbqr.pdf ![]()
Zonal-mean tendency plots can be found here: ![]() NoBimol_xlbqr_NOy_UKCA_tendency.pdf
NoBimol_xlbqr_NOy_UKCA_tendency.pdf ![]()
Flowchart
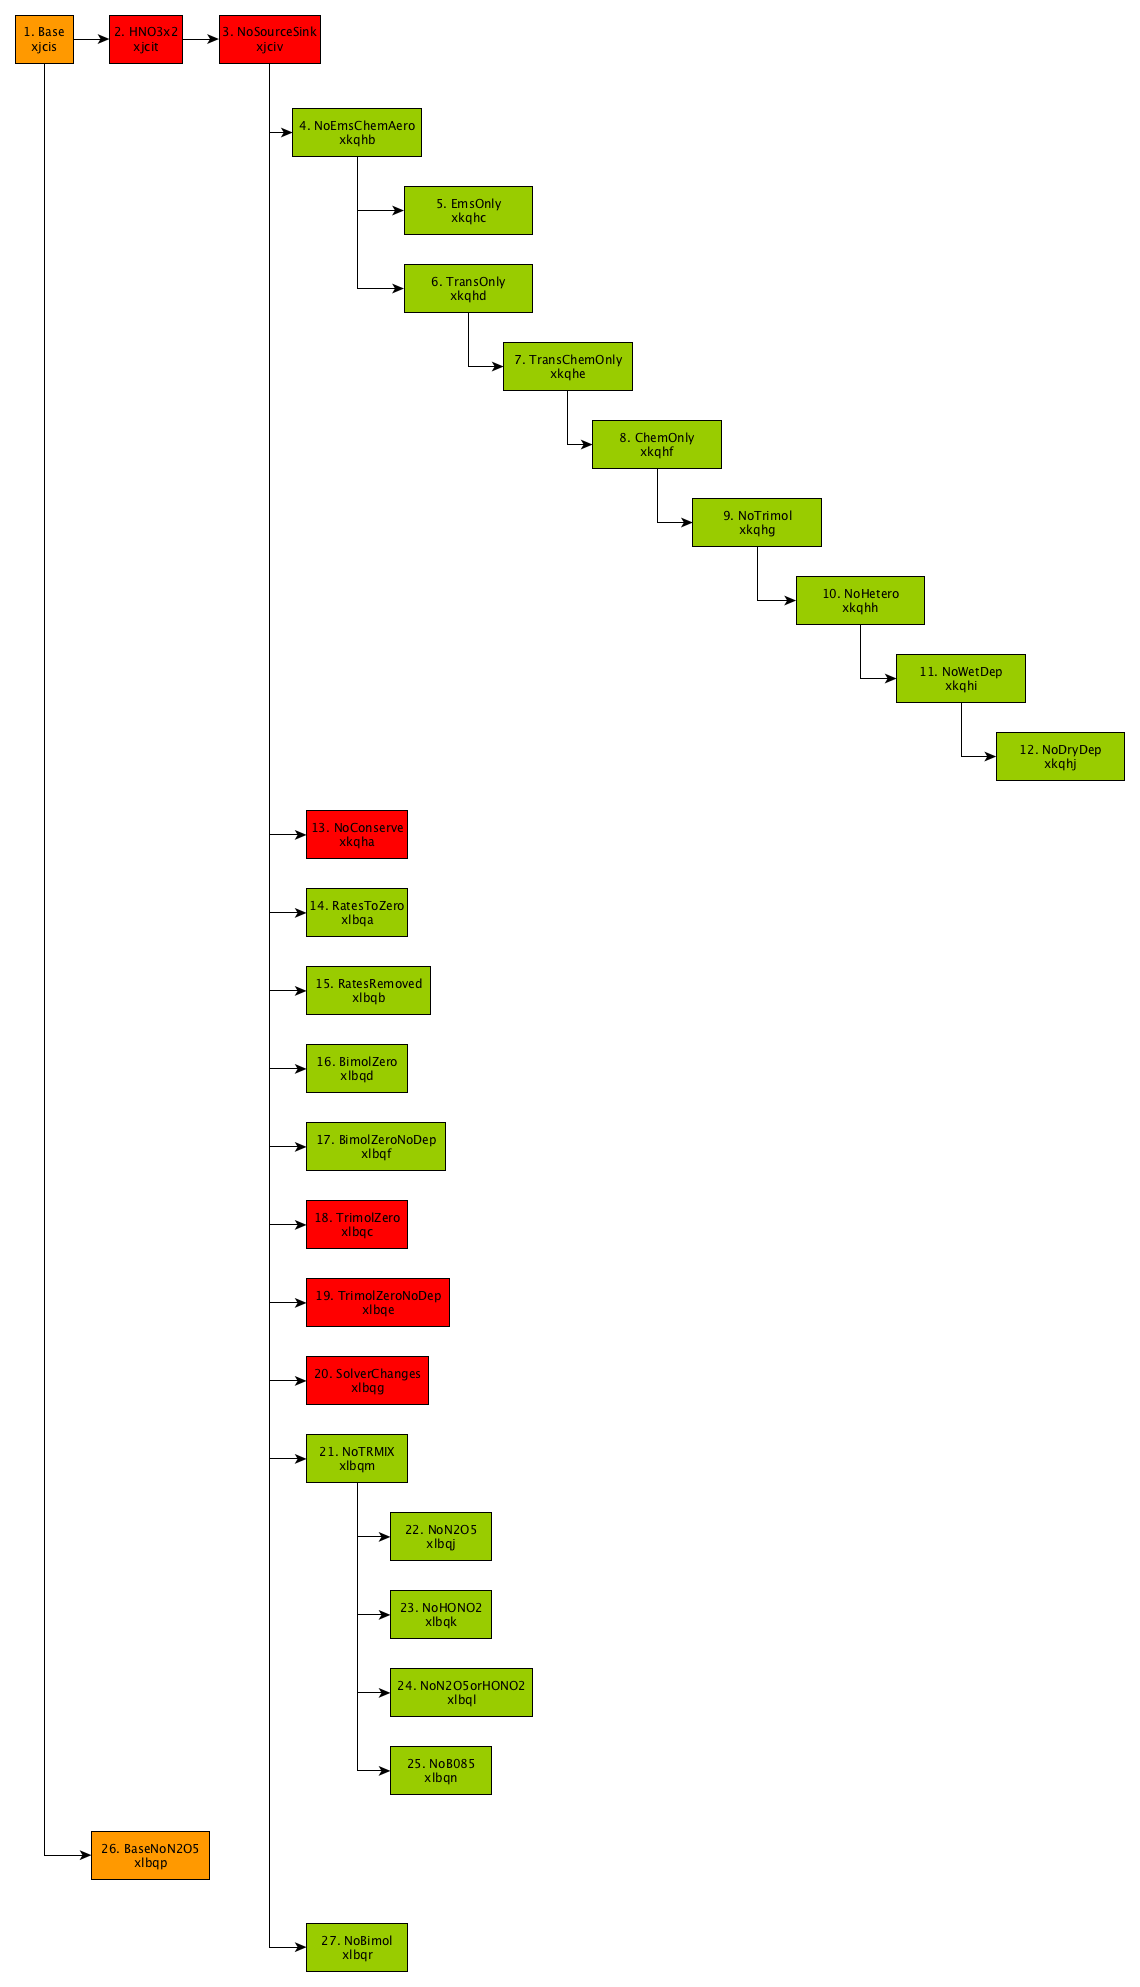
A flowchart showing how the jobs are related is shown below.
Key
- Red: loss of NOy observed
- Orange: loss of NOy not observed, but underlying problem may still exist
- Green: loss of NOy not observed
This is also available as a .pdf: ![]() Jobs_FlowChart.pdf
Jobs_FlowChart.pdf ![]()
Suggested Further Tests 2015-05-19
Following a meeting of LA, JP, AA, PG, & JK, the following tests were suggested:
- Copy xiciv:
- Turn off TR_MIX
- Turn off ASAD_HETERO
- Check solver initialisation and try initialising every timestep
- Set NOy to zero from all bar one block in ukca_chem_strattop and run (~5 runs)


