Difference between revisions of "Interactive emissions"
(Create page to describe interactive emissions) |
(→Interactive Biogenic Emissions: update with bugfixed emissions.) |
||
| (2 intermediate revisions by the same user not shown) | |||
| Line 7: | Line 7: | ||
[[File:Isoprene_emissions_climatological.png]] |
[[File:Isoprene_emissions_climatological.png]] |
||
| − | The interactive emissions are based upon the scheme of [http://www.atmos-chem-phys-discuss.net/10/28311/2010/acpd-10-28311-2010.html Pacifico et al (2010)] |
+ | The interactive emissions are based upon the scheme of [http://www.atmos-chem-phys-discuss.net/10/28311/2010/acpd-10-28311-2010.html Pacifico et al (2010)] as implemented by Gerd Folberth at the Met Office. |
| + | A years average emissions using the interactive scheme are shown below. |
||
| − | as implemented by Gerd Folberth at the Met Office. |
||
| − | We have implemented the scheme into a branch taken from the VN7.3 standard branch, with some changes, for instance ensuring that the land sea fraction has been applied. |
||
| − | When we run we see emissions that look like |
||
| − | [[File: |
+ | [[File:Isoprene_emissions_interactive_v2.png]] |
| + | The distribution is broadly similar, with the most notable difference being seen in increases in Africa. |
||
| − | (though note there is a global scaling factor of 2.5 applied here). These will be available in the near future. |
||
| + | The emissions model also produces terpene emissions as well. |
||
| + | The total emissions for this particular year is 480 Tg of carbon compared to 440 Tg C with the climatological scheme. |
||
Latest revision as of 12:10, 2 April 2011
Interactive Biogenic Emissions
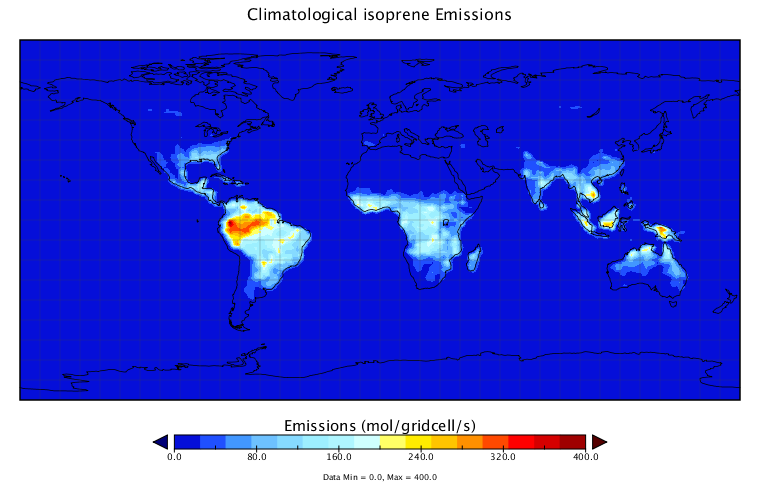
We are in the process of implementing interactive biogenic emissions at UM7.3 based upon the code used at UM7.7 in the ExTC branch. Initially we are looking at isoprene emissions, but terpenes emissions will be available as well. In the standard model isoprene emissions are calculated from a climatology (emissions shown below):
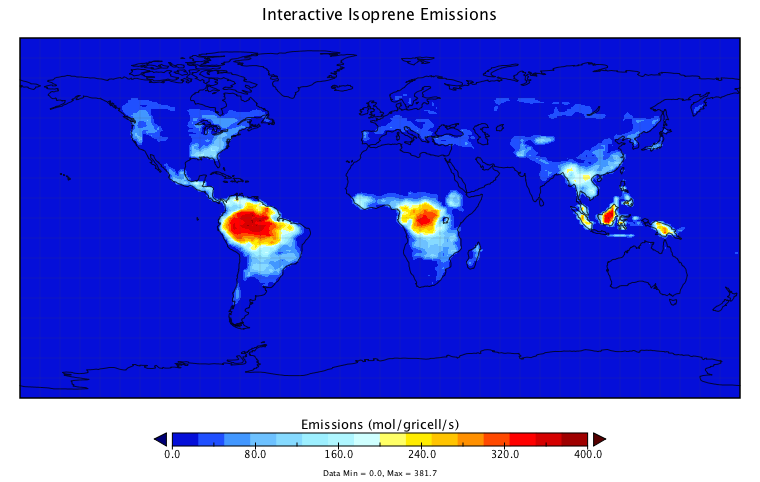
The interactive emissions are based upon the scheme of Pacifico et al (2010) as implemented by Gerd Folberth at the Met Office. A years average emissions using the interactive scheme are shown below.
The distribution is broadly similar, with the most notable difference being seen in increases in Africa. The emissions model also produces terpene emissions as well. The total emissions for this particular year is 480 Tg of carbon compared to 440 Tg C with the climatological scheme.

