Radon tracer
Radon Tracer
Dr. Fiona O'Connor, UK Meteorological Office.
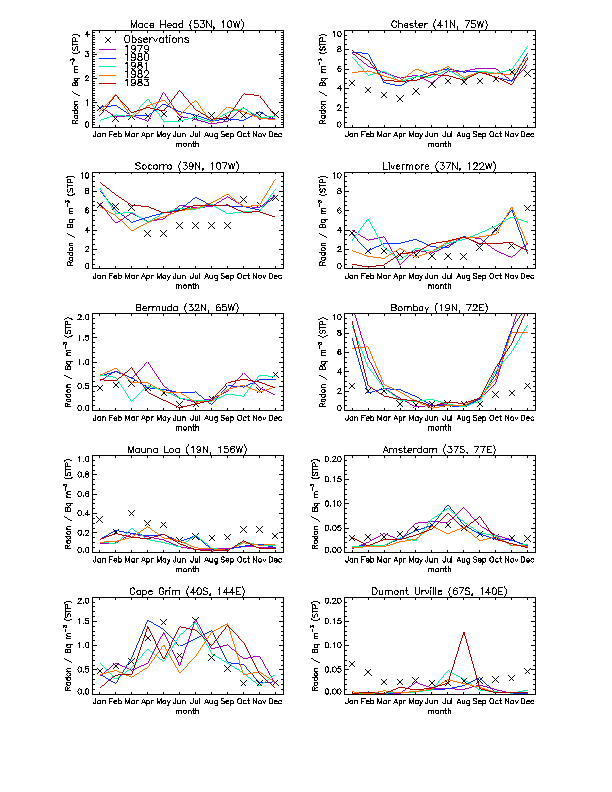
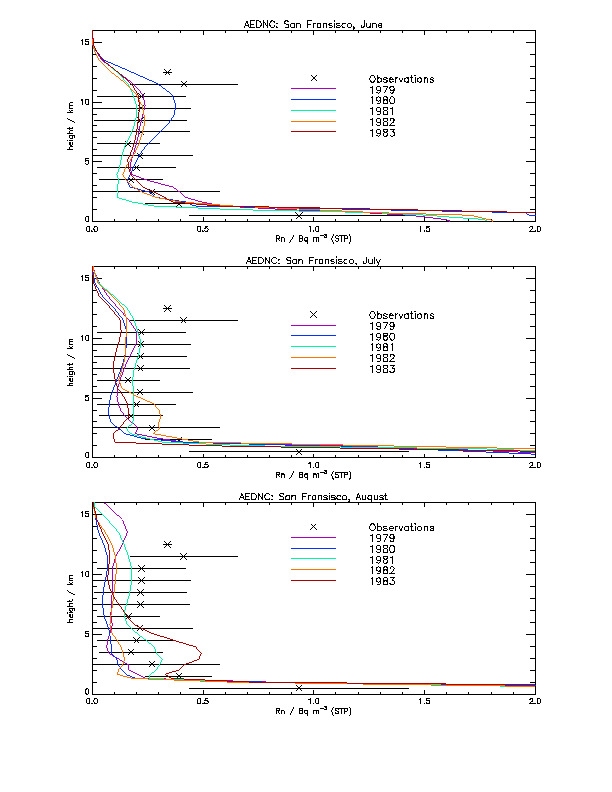
In this experiment, a very simple radon/lead experiment was included in the Hadley Centre's climate model, HadGEM1. Radon was emitted from all non-frozen land points, followed by radioactive decay to lead with a half life of 3.8 days. Lead was subsequently treated as an inert tracer in this experiment even though it readily attaches itself to submicron aerosol and is removed by wet deposition. Comparisons of modelled monthly mean radon concentrations at the surface and in the vertical can be seen in Figure 1 and Figure 2. The surface comparison shows that modelled concentrations at Mace Head, Amsterdam and Cape Grim are reproduced very well, both in terms of the absolute concentrations and seasonal cycle. However, there are some discrepancies at the other stations. Observed concentrations at Dumont Urville, for example, are reproduced during the southern hemisphere winter but poorly simulated in the Summer; this discrepany was also noted in previous studies e.g. Hauglustaine et al. 2004, Taguchi et al. 2002. Figure 2 compares profiles of modelled radon concentrations over San Francisco (37.4N, 122W) with measurements taken during 11 aircraft flights. These flights were carried out during June and August 1994 and modelled output for June, July, and August has been plotted against the measured profiles separately. All modelled profiles capture the steep vertical gradient in the boundary layer but only output from June appears to capture the enhanced concentrations in the upper troposphere.
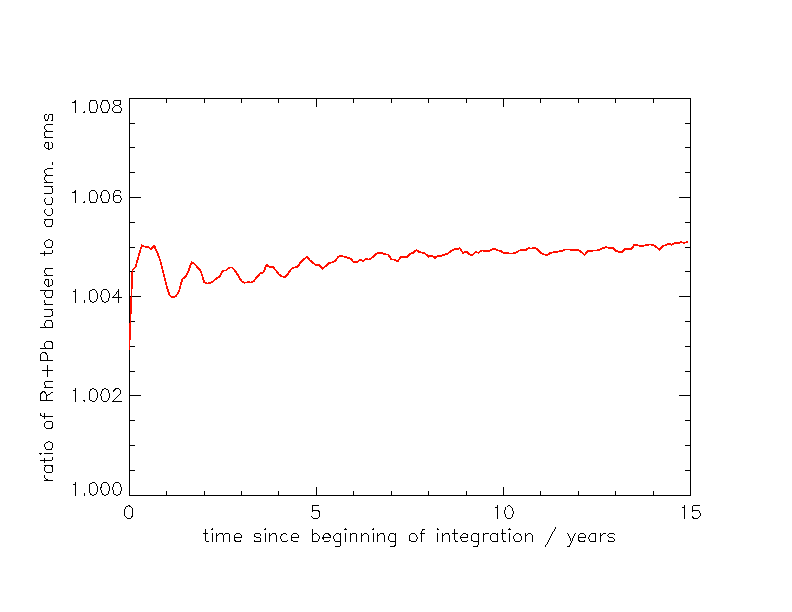
The experiment can also be used to assess tracer conservation in the climate model, HadGEM1, because lead was treated as an inert tracer. Because no change in mass between radon and lead was taken into account, the ratio of the global burden of radon and lead to the mass of the accumulated emissions of radon should be 1 and constant throughout the model integration if the model is conserving mass exactly. Figure 3 shows a timeseries of this ratio. It indicates that between 1 and 6 years, there is a linear trend although this appears to be levelling off after 6 years. There is also a significant initial offset. However, both the offset and the trend are markedly improved from UMv5.3 (Morgenstern et al. 2003), in which an offset of 0.7% was evident as well as a positive trend of 0.05% per year. This follows a correction in the boundary layer scheme between versions 5.3 and 5.5.


